. 2025 Aug 26;22(1):207.
doi: 10.1186/s12974-025-03532-1.

Disrupted betaine metabolism drives Th17 cell differentiation, mediating methamphetamine-induced depressive behaviors in male mice

Affiliations

Disrupted betaine metabolism drives Th17 cell differentiation, mediating methamphetamine-induced depressive behaviors in male mice

Rongji Hui et al. J Neuroinflammation. .

Abstract

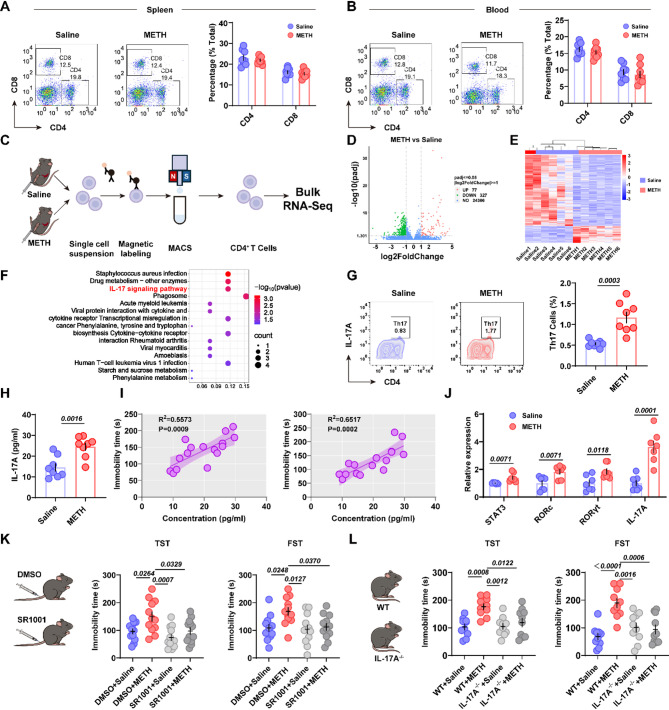
Methamphetamine (METH) abuse, a global public health concern, is closely linked to neuropsychiatric disorders such as depression. Although the central nervous system (CNS) damage induced by METH is well documented, the role of peripheral immune mechanisms remains underexplored. To investigate this, we establish a depressive-like mouse model in male mice using repeated intraperitoneal METH injections. Behavioral tests, flow cytometry, RNA sequencing and metabolomics reveal the underlying mechanisms. METH exposure increases the differentiation of CD4⁺ T cells into Th17 cells in the spleen, likely driven by mitochondrial dysfunction and impaired betaine metabolism. These Th17 cells secrete elevated IL-17 A, which binds to IL-17RA on hippocampal CA1 neurons, activates the p38 MAPK signaling pathway, and disrupts synaptic plasticity. Interventions targeting Th17 cells or IL-17 A signaling significantly reduce depressive behavior. These findings uncover a novel peripheral immune mechanism in METH-related depression, wherein CD4⁺ T cell-derived IL-17 A contributes to hippocampal dysfunction via IL-17RA/p38 MAPK signaling. Targeting Th17 cells or IL-17 A may represent a promising therapeutic strategy for METH-associated neuropsychiatric disorders.

Supplementary Information: The online version contains supplementary material available at 10.1186/s12974-025-03532-1.

Keywords: Betaine metabolism; CD4⁺ T cells; Depressive behaviors; Methamphetamine; Synaptic plasticity; Th17 cells.


Conflict of interest statement

Declarations. Ethics approval and consent to participate: The animal experiments were conducted following the guidelines outlined in the National Institutes of Health Guide for the Care and Use of Laboratory Animals and were approved by the Local Animal Use Committee of Hebei Medical University (approval no., IACUC-Hebmu-P2020072). Competing interests: The authors declare no competing interests.

Figures

Fig. 1
Fig. 1
CD4⁺ T cells contribute to METH-induced depressive behavior. A Schematic diagram of drug treatment and experimental design. B Body temperature changes (n = 6) and stereotypic behavior scores (n = 10) in mice following METH administration. C Representative activity curve and immobility time in the tail suspension test (TST) 7 days after METH treatment (n = 10). D Representative activity curve and immobility time in the forced swimming test (FST) (n = 10). E Representative flow cytometry plots of immune cell subsets and immobility time in the TST and FST of wild-type (WT) and Rag-/- mice (n = 8). F Immobility time in the TST and FST following neutralizing antibody treatment (n = 12). G Schematic diagram of CD4⁺ T cell adoptive transfer experiment. H Immobility time in the TST and FST after CD4⁺ T cell transfer without METH treatment (n = 8). I Immobility time in the TST and FST after CD4⁺ T cell transfer followed by METH administration (n = 8). Data are presented as mean ± SEM
Fig. 2
Fig. 2
METH administration promotes differentiation of CD4⁺ T cells into Th17 cells. A Proportions of splenic CD4⁺ and CD8⁺ T cells after METH treatment (n = 8). B Proportions of peripheral blood CD4⁺ and CD8⁺ T cells after METH treatment (n = 8). C Schematic diagram of MACS-based CD4⁺ T cell isolation and bulk RNA sequencing. D Volcano plot of differentially expressed genes. E Heatmap of hierarchical clustering of differentially expressed genes. F Enriched upregulated pathways identified by KEGG analysis. G Proportion of Th17 cells in the spleen after METH treatment (n = 8). H Serum IL-17 A levels following METH administration (n = 8). I Correlation analysis between IL-17 A levels and immobility time in the TST and FST (n = 16). J Relative expression levels of Th17-related genes (n = 7). K Effects of SR1001 treatment on immobility time in the TST and FST (n = 12). L Immobility time in the TST and FST in IL-17 A-/- and WT mice (n = 10). Data are presented as mean ± SEM
Fig. 3
Fig. 3
Mitochondrial dysfunction and altered betaine metabolism in CD4⁺ T cells. AD Untargeted metabolomics in positive ion mode (n = 6). A Principal component analysis (PCA) of differential metabolites in CD4⁺ T cells. B Partial least squares discriminant analysis (PLS-DA). C Clustering heatmap of differential metabolites. D Z-score plot of differential metabolites. E Schematic diagram of the betaine synthesis pathway. F Quantification of betaine and choline levels in CD4⁺ T cells (n = 8). G Correlation analysis between choline and betaine levels (n = 16). H Expression of CHDH in CD4⁺ T cells (n = 5). I Representative transmission electron microscopy (TEM) images of CD4⁺ T cells following METH treatment. JK Effects of METH treatment on mitochondrial membrane potential (n = 3). L Measurement of reactive oxygen species (ROS) levels (n = 5). M ATP production (n = 5). N Effect of betaine supplementation on the proportion of Th17 cells (n = 6). O Relative expression levels of STAT3 and RORγt after betaine treatment (n = 6). Data are presented as mean ± SEM
Fig. 4
Fig. 4
Betaine attenuates Th17 cell differentiation by modulating DNA methylation. A Schematic diagram of betaine involvement in methyl metabolism. B S-adenosylmethionine (SAM) and homocysteine levels in CD4⁺ T cells (n = 8). C Differential distribution of methylation sites in the STAT3 gene. D Methylation status of CpG sites within the STAT3 promoter region in individual cells (avg indicates average methylation across sites). E Methylation levels across the STAT3 promoter region among different samples. F Differential distribution of methylation sites in the RORc gene. G Methylation status of CpG sites within the RORc promoter region in individual cells (avg indicates average methylation across sites). H Methylation levels across the RORc promoter region among different samples. *: P < 0.05, **: P < 0.01, ***: P < 0.001. I Schematic diagram of 5-Azacytidine (5-Aza)-mediated DNA methylation inhibition. J Effects of 5-Aza treatment on Th17 cell differentiation (n = 6). K Effects of 5-Aza on STAT3 and RORc expression levels (n = 6). Data are presented as mean ± SEM
Fig. 5
Fig. 5
IL-17 A crosses the damaged blood–brain barrier and acts on IL-17RA in the hippocampal CA1 region. A IL-17 A levels in the hippocampus (n = 6). B Permeability of sodium fluorescein and Evans blue (n = 6). C Expression levels of Occludin and Claudin-5 (n = 6). D Distribution of IL-17RA among different neuronal subtypes in the hippocampal CA1 region. E Schematic diagram of rAAV injection sites. F Effects of IL-17RA knockdown in the hippocampal CA1 region on immobility time in TST and FST (n = 8). Data are presented as mean ± SEM
Fig. 6
Fig. 6
IL-17 A activates p38 signaling via IL-17RA to induce synaptic plasticity impairment. A Effects of IL-17RA signaling on expression of JNK, ERK, and p38 pathway-related proteins (n = 6). B Schematic diagram of cannula implantation and injection procedure. C Effects of intra-CA1 injection of the p38 inhibitor SB203580 on immobility time in TST and FST (n = 6). D Representative diagram of dendritic spine morphology. E Quantification of dendritic spine density (n = 6). F Proportions of different types of dendritic spines. G Proportions of mushroom- and thin-type dendritic spines (n = 6). H Effects of p38 pathway inhibition on PSD95 and Synapsin-1 expression levels (n = 6). Data are presented as mean ± SEM

References

    1. Duncan Z, Kippen R, Sutton K, Ward B, Agius PA, Quinn B, Dietze P. Correlates of anxiety and depression in a community cohort of people who smoke methamphetamine. Aust N Z J Psychiatry. 2022;56:964–73. - PubMed
    1. Li J, Jiang W, Zhu R, Fan F, Fu F, Wei D, Tang S, Tian Y, Chen J, Li Y, et al. Depression in Chinese men with methamphetamine dependence: prevalence, correlates and relationship with alexithymia. J Affect Disord. 2022;319:235–43. - PubMed
    1. Glasner-Edwards S, Mooney LJ. Methamphetamine psychosis: epidemiology and management. CNS Drugs. 2014;28:1115–26. - PMC - PubMed
    1. Kelly BC, LeClair A, Parsons JT. Methamphetamine use in club subcultures. Subst Use Misuse. 2013;48:1541–52. - PMC - PubMed
    1. Matsumoto RR, Seminerio MJ, Turner RC, Robson MJ, Nguyen L, Miller DB, O’Callaghan JP. Methamphetamine-induced toxicity: an updated review on issues related to hyperthermia. Pharmacol Ther. 2014;144:28–40. - PMC - PubMed

LinkOut - more resources