. 2025 Aug 26;13(1):184.
doi: 10.1186/s40478-025-02054-4.

Astrocyte-neuron combined targeting for CYP46A1 gene therapy in Huntington's disease

Affiliations

Astrocyte-neuron combined targeting for CYP46A1 gene therapy in Huntington's disease

Louis-Habib Parsai et al. Acta Neuropathol Commun. .

Abstract

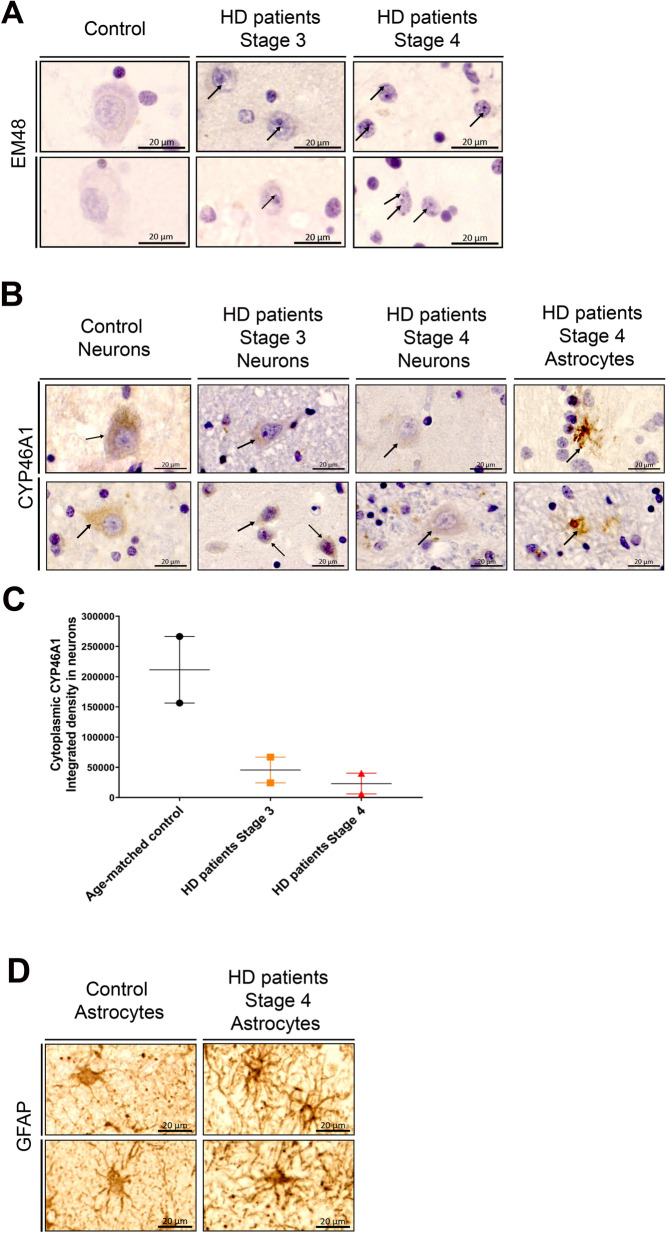
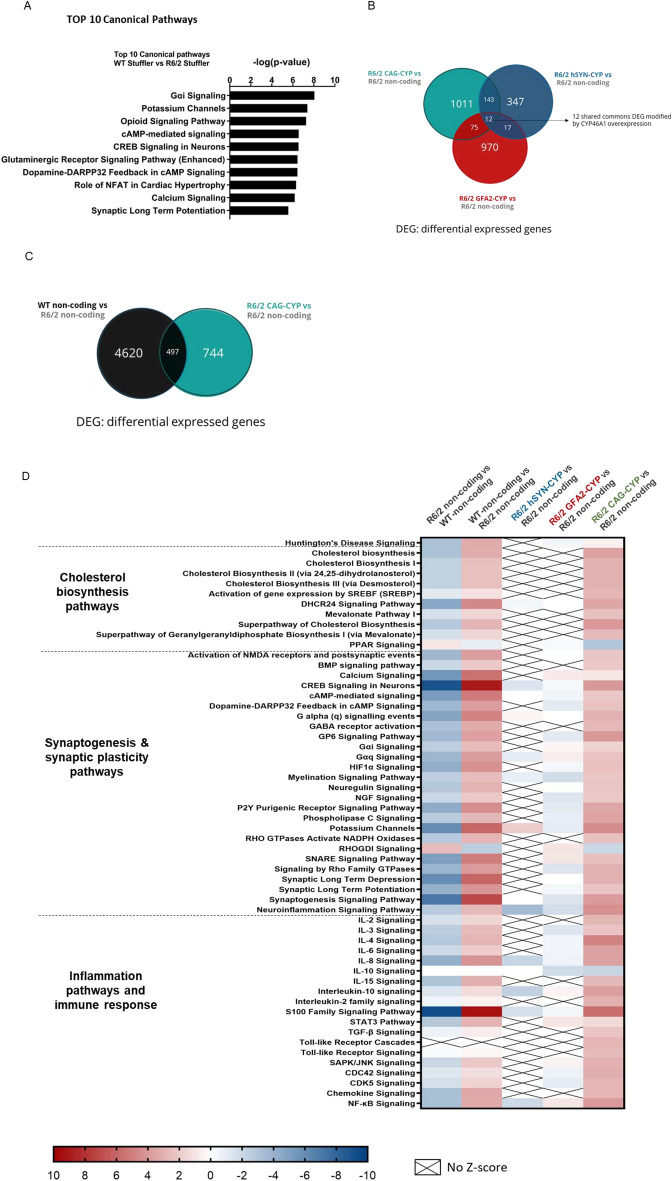
Huntington's disease (HD) is an autosomal dominant neurodegenerative disease caused by an abnormal expansion of cytosine-adenine-guanosine (CAG) trinucleotidein the huntingtin gene. Mutant huntingtin (mHTT) expression in neurons and glial cells affects neuron and astrocyte functions and leads to the loss of medium spiny neurons of the striatum. Brain cholesterol pathway is severely affected by HTT mutation in neurons and astrocytes, contributing to HD pathogenesis. Decreased cholesterol production and transport by astrocytes impair synapse maturation and neurotransmission. Brain cholesterol metabolism is maintained by cholesterol hydroxylation into 24-hydroxycholesterol by the neuronal enzyme cholesterol 24-hydroxylase (CYP46A1). CYP46A1 is decreased in affected brain regions in HD patients and mice. AAV-CYP46A1 striatal delivery was shown to restore cholesterol metabolism with neuroprotective effects in two mouse models of HD, characterized by mHTT aggregates' reduction, improved transcriptomic profile, and Brain-Derived Neurotrophic Factor (BDNF) signaling, and preservation of striatal neurons. From a therapeutic perspective, we intended to clarify the detailed mechanisms and the specific role of neurons and astrocytes in the therapeutic effects of AAV-CYP46A1 delivery. We first evaluated CYP46A1 expression in astrocytes in HD post-mortem putamen at a late stage of disease progression. To determine the specific contribution of CYP46A1 expression in astrocytes compared to neurons on the HD phenotype, we assessed the effects of AAV-CYP46A1 striatal injection under the control of astrocytic (GFA2) or neuronal (hSYN) promoters in R6/2 mice. Overall, equivalent transgenic CYP46A1 protein levels, both astrocytic and neuronal targeting, mitigate medium ppiny neuron (MSN) atrophy and improve spine density in R6/2 mice. Reduction of mHTT aggregates in neurons is similar when CYP46A1 is overexpressed in neurons or in astrocytes. However, astrocyte targeting reduces mHTT aggregates in neurons and astrocytes, while restricted neuronal targeting reduces mHTT aggregates in neurons only. Altogether, astrocytic targeting of CYP46A1 expression in CYP46A1-tested animals combines cell-autonomous and non-cell-autonomous mechanisms of action, with improved phenotypic correction compared to neuronal-restricted targeting. Allowing expression in both cell types with higher expression levels of CYP46A1 showed overall better efficacy. We demonstrate that astrocyte-neuron combined targeting with AAV-CAG-CYP46A1 delivery increases therapeutic efficacy. This study brings new evidence that CAG-mediated CYP46A1 striatal overexpression significantly modifies the transcriptome in R6/2 mice for pathways involved in synaptogenesis and inflammation, suggesting targeting both astrocytes and neurons provides benefits for HD phenotypic correction.

Keywords: Astrocytes; Cholesterol; Inflammation; Neurons; Synapses.


Conflict of interest statement

Declarations. Ethics approval consent to participate: Regarding experiments realized on R6/2 mice and WT-littermates, all animal procedures and experiments were approved by the local ethical committee (Ethical Committee of IBPS, n° 05) and the French Ministry of National Education, Higher Education and Research (reference number APAFIS #12412–2017113010191653 v7) and were performed in accordance with the Guide for the Care and Use of Laboratory Animals (US National Institutes of Health). The HD brains were donated after informed consent by the patients themselves during life and these donations were supported by the spouse and doctors of these patients. The Medical Ethical committee of the University Medical Centre Groningen, the Netherlands approved the brain donation procedure, as well as the donation form and patient information. Consent for publication: I give my consent for the publication of the manuscript titled Astrocyte-neuron combined targeting for CYP46A1 gene therapy in Huntington’s disease in Acta Neuropathologica communications. All co-authors have approved the final version, and we agree to the submission and publication. I confirm that all necessary permissions and consents (including for images or personal data) have been obtained. Competing interests: The clinical application of gene therapy approach for CYP46A1 delivery in Huntington’s disease is protected by the published patent filed in Europe and the United States, PCT/EP2011/068033 and WO2012049314A1, respectively.

Figures

Fig. 1
Fig. 1
CYP46A1 is re-expressed in astrocytes of HD patients. A Representative immunohistochemically labelled brain sections of putamen (Anti-HTT immunostaining using the EM48 antibody, counterstained with Hematoxylin) from HD patients (n = 4) and age-matched controls (n = 2) revealed nuclear and cytosolic mutant Huntingtin aggregates in neurons (black arrows) but not in control individuals. Scale bar: 20 μm. B Anti-CYP46A1 immunostaining counterstained with Hematoxylin showing intense and diffuse cytoplasmic CYP46A1 immunoreactivity in control neurons (n = 2) while it was decreased in neurons from HD patients at stage 3 and 4 (n = 4), stage 4 HD patients also exhibited re-localization of CYP46A1 in astrocytic cell-like soma and dendrites (n = 2) (black bold arrows). Scale bar: 20 μm. C Quantification of CYP46A1 cytoplasmic intensity staining in HD patients at Vonsattel stage 3 (n = 2), at Vonsattel stage 4 (n = 2) and age-matched controls (n = 2). D Diaminobenzidine (DAB)-directed immunostaining for GFAP in the striatum of control individuals (n = 2) and HD patients (n = 4): hypertrophic soma of astrocytes was detected in HD patients relatively to those from control individuals. Scale bar 20 μm
Fig. 2
Fig. 2
Evaluation of cellular tropism based on neuronal and glial promoter selectivity and transduction efficacy after delivery of AAVrh10 vectors coding for HA-CYP46A1 in mouse striatum. A–C Representative laser confocal microscopy images of double immunofluorescence between HA (red) and several cell-type specific markers [NeuN for neurons (green), GFAP for astrocytes (green) and Iba1 for microglia (green), and Olig 2 for oligodendrocytes (green)] in coronal brain slices from C57BL/6J, 3 weeks post-injection. Scale bar: 20 μm. D Quantification of cellular tropism after AAVrh10-CAG-HA-CYP46A1 (n = 3) showing that among HA + cells, 82% are NeuN + cells, 10% are Olig2 + and 8% GFAP + cells. No detectable HA-CYP46A1 immunoreactivity was detected in microglia (Iba1). E Quantification of cellular tropism after AAVrh10-hSYN-HA-CYP46A1 (n = 3) showing that among all HA + cells, 98.4% are NeuN + cells and 1.6% are Olig2 + ; no immunoreactivity was detected in both Iba1 + and GFAP + cells. F Quantification of cellular tropism after AAVrh10-GFA2-HA-CYP46A1 injection (n = 3) showing that among all HA + cells, 98.5% are GFAP + cells and 1.5% are Olig2 + ; no immunoreactivity was detected in both NeuN + and Iba1 + cells. Data are represented as the mean ± S.E.M. G–H Representative western blot of total CYP46A1 levels in striatal extracts from 12-week-old R6/2 mice and injected with the different constructs and age-matched WT-littermates (8 weeks after injection). For optical densitometry quantification signal intensities were normalized to vinculin protein, used as loading control. Data are represented as the mean ± S.E.M (n = 3/group). Statistical analysis was performed using One-way ANOVA followed by Dunnett post-hoc test: * P < 0.05; **** P < 0.0001 relatively to R6/2 non-coding as mean group control. I Quantification of vector genome copy number per cell assessed by qPCR in the striatum of R6/2 mice injected with the different constructs showing that no statistically significant differences were found between groups. Data are represented as the mean ± S.E.M (n = 3–6/group). Statistical analysis was performed using One-way ANOVA followed by Dunnett post-hoc test, with R6/2 non-coding as mean control
Fig. 3
Fig. 3
Regulation of cholesterol homeostasis by CYP46A1 overexpression in striatal neurons or astrocytes of R6/2 mice, 8 weeks after striatal injection. Quantification of Cholesterol A, 24S-OH-Cholesterol B, 27-OHC C, Lanosterol D, 7-Lathosterol E, Desmosterol F, 7-Dehydrocholesterol (7-DHC) G and 8-Dehydrocholesterol (8-DHC) H in striatal tissue from 12 weeks-old (i.e., 8 weeks post-injection) WT and R6/2 mice injected with non-coding vector or AAVrh10-HA-CYP46A1 mediated by CAG, hSYN, GFA2 promoters. Results are represented as the mean ± SEM, (n = 7–10 independent mice). Statistical analyses: Multiple t-test * P < 0.05; **P < 0.01; *** P < 0.001; **** P < 0.0001. I Schematic representations of Cholesterol precursors, Cholesterol, and oxysterol deficit in Huntington’s disease (upper left panel) and the impact CYP46A1 overexpression under either CAG promoter (upper right panel), hSYN promoter (lower left panel) and GFA2 (lower right panel). Legends are detailed at the bottom
Fig. 4
Fig. 4
Overexpression of CYP46A1 in striatal astrocytes or neurons from R6/2 mice decreases the number of Huntingtin aggregates in a cell and non-cell autonomous effect, 8 weeks after striatal injection. A Upper panel: representative images of mHTT aggregates in the R6/2 striatum (EM48 + , violet dots) in HA + area (green) among the different groups, injected with the different AAV constructs(n = 10–12/group). Middle panel: representative images of mHTT aggregates (EM48 + , violet dots) in HA + area (green) among the different R6/2 groups in NeuN + cells (cyan) (n = 5–7/group). Lower panel: representative images of mHTT aggregates (EM48 + , violet dots) in HA + area (green) among the different R6/2 groups in S100β + cells (cyan) (n = 5–7/group). B Quantified data showing the percentage of reduction of the total amount of mHTT aggregates in neurons following AAV-CYP46A1 delivery mediated by CAG, hSYN and GFA2 promoters in HA + positive area. No differences were detected between non-injected R6/2 and R6/2 mice injected with non-coding vector. Data are represented as the mean ± S.E.M. Statistical analysis: one-way ANOVA followed by Dunnett’s post-hoc test (**P < 0.01 R6/2 AAVrh10-CAG-HA-CYP46A1 vs R6/2 AAVrh10-non-coding; **P < 0.01 R6/2 AAVrh10-GFA2-HA-CYP46A1 vs R6/2 AAVrh10-non-coding). C Quantified data showing the percentage reduction of the total amount of mHTT aggregates in neurons following CYP46A1 delivery mediated by CAG and GFA2 promoters. No differences were observed between non-injected R6/2 and R6/2 mice injected with non-coding vector and in R6/2 receiving AAVrh10-hSYN-CYP46A1 (P = 0.098). Data are represented as the mean ± S.E.M. Statistical analysis: one-way ANOVA followed by Dunnett’s post-hoc test (** P < 0.01 R6/2 AAVrh10-CAG-HA-CYP46A1 vs R6/2 AAVrh10-non-coding; **P < 0.01 R6/2 AAVrh10-GFA2-HA-CYP46A1 vs R6/2 AAVrh10-non-coding). D Quantified data showing the percentage reduction of the total amount of mHTT aggregates in astrocytes following CYP46A1 delivery mediated by CAG and GFA2 promoters. No differences were observed between non-injected R6/2 and R6/2 mice injected with non-coding vector and in R6/2 receiving AAVrh10-hSYN-HA-CYP46A1. Data are represented as the mean ± S.E.M. Statistical analysis: one-way ANOVA followed by Dunnett’s post-hoc test (***P < 0.001 R6/2 AAVrh10-CAG-HA-CYP46A1 vs R6/2 AAVrh10-non-coding; ** P < 0.01 R6/2 AAVrh10-GFA2-HA-CYP46A1 vs R6/2 AAVrh10-non-coding)
Fig. 5
Fig. 5
MSN atrophy and reduced spine density are improved upon CYP46A1 delivery in l neurons and/or astrocytes from R6/2 mice in a cell and non-cell-autonomous dependent mechanism, 8 weeks after injection. A Representative laser confocal microscopy images of the double immunostaining between DARPP-32, a marker of medium spiny neurons (red) in HA + area (green), in brain slices from R6/2 mice and WT littermates, injected with the different AAV constructs. B The quantification of MSN area is expressed in mm2. Data are represented as the mean ± S.E.M. Statistical analysis: one-way ANOVA followed by Dunnett’s post-hoc test [****P < 0.0001 WT AAVrh10-CAG-non-coding (n = 7) vs R6/2 AAVrh10-CAG-non-coding (n = 6); ****P < 0.0001 R6/2 AAVrh10-CAG-HA-CYP46A1 (n = 5) vs R6/2 AAVrh10-CAG-non-coding; *P < 0.05 R6/2 AAVrh10-hSYN-HA-CYP46A1 (n = 5) and R6/2 AArh10-GFA2-HA-CYP46A1 (n = 6) vs R6/2 AAVrh10-CAG-non-coding (n = 6); *P < 0.05 R6/2 AAVrh10-CAG-HA-CYP46A1 (n = 5) vs R6/2 AAVrh10-hSYN-HA-CYP46A1 (n = 5); ***P < 0.001 R6/2 AAVrh10-CAG-HA-CYP46A1 (n = 5) vs R6/2 AAVrh10-GFA2-HA-CYP46A1 (n = 6)]. C Images of Golgi-Cox-stained medium spiny dendrites in brain slices from R6/2 mice and age-matched WT littermates injected with the different AAV constructs. Scale bar = 5 mm. D Spine number was reduced in AAVrh10-CAG-non-coding injected mice (N = 4/n = 29) compared to WT AAVrh10-CAG-non-coding injected mice (N = 4/n = 32) (****P < 0.0001), and then improved upon overexpression of HA-CYP46A1 driven by the CAG (N = 4/n = 25), GFA2 (N = 4/n = 31) and hSYN (N = 4/n = 31) promoters in the R6/2 mouse striatum (***P < 0.0001, * P < 0.05 and P = 0.0001, respectively). Data are represented as mean ± SEM. one-way ANOVA followed by Bonferroni’s post-hoc test. “N” represents the number of animals and “n” the number of dendrites
Fig. 6
Fig. 6
Overexpression of CYP46A1 in striatal astrocytes and neurons improves motor abilities in R6/2 mice. A Experimental set-up for striatal injection of CYP46A1 and time frame of behavioral tests performed. B Rotarod performances of wild-type littermates, non-injected R6/2 mice and R6/2 mice injected with control non-coding vector or the different AAV-CYP46A1 coding constructs were assessed by the latency to fall (expressed in seconds) from 6 to 11 weeks (measured for each group). Blinded-randomization of the group was maintained throughout the test. Data are represented as the mean ± SEM. Statistical analysis: Two-way ANOVA followed by Dunnett’s post-hoc test with time and treatment as independent factors [(**** P < 0.0001: WT-type non-coding (n = 12) vs R6/2 non-coding (n = 14); *P < 0.05: R6/2 CAG (n = 13) vs R6/2 non-coding (n = 14) and R6/2 GFA2 (n = 17) vs R6/2 non-coding (n = 14)]
Fig. 7
Fig. 7
Striatal overexpression of CYP46A1 driven by mean of glial and neuronal promoters modifies major transcriptome pathways, including cholesterol biosynthesis, inflammation cascades, synaptogenesis, and synaptic plasticity pathways, 8 weeks after injection. A Top 10 IPA canonical pathways WT-CAG-non-coding (n = 4) vs R6/2 CAG-non-coding injected mice (n = 4). B The number of DEGs overlap between R6/2 CAG-non-coding (n = 4) vs R6/2 AAVrh10-CAG-HA-CYP46A1 (green) (n = 5) and R6/2-CAG-non-coding (n = 4) vs R6/2 AAVrh10-GFA2-HA-CYP46A1 (red) (n = 5) and R6/2-CAG-non-coding (n = 4) vs R6/2 AAVrh10-hSYN-HA-CYP46A1 (blue) (n = 4). C The number of DEGs overlap between WT-CAG-non-coding (n = 4) vs R6/2 CAG-non-coding (n = 4) and vs R6/2 AAVrh10-CAG-HA-CYP46A1 (green) (n = 5) vs R6/2 CAG-non-coding (n = 4) D Pathways are significantly altered (cut off: P < 0.05; z-score = 2 (absolute value)) in R6/2 CAG-non-coding compared to WT-CAG-non-coding, 8 weeks after injection; and R6/2 AAVrh10-CAG-HA-CYP46A1, AAVrh10-GFA2-HA-CYP46A1, or R6/2 AAVrh10-hSYN-HA-CYP46A1 compared to R6/2 CAG-non-coding. Cholesterol pathways are highlighted in green. The IPA z-score indicates if the pathway is predicted to be inhibited (blue), activated (red) or activation or inhibition cannot be predicted (grey)

References

    1. Bates GP, Dorsey R, Gusella JF et al (2015) Huntington disease. Nat Rev Dis Primers 1(April):1–21. 10.1038/nrdp.2015.5 - PubMed
    1. Ghosh R, Tabrizi SJ (2018) Huntington disease. Handbook of Clin Neurol 147:255–278. 10.1016/B978-0-444-63233-3.00017-8 - PubMed
    1. MacDonald ME, Ambrose CM, Duyao MP et al (1993) A novel gene containing a trinucleotide repeat that is expanded and unstable on Huntington’s disease chromosomes. Cell 72(6):971–983. 10.1016/0092-8674(93)90585-E - PubMed
    1. Saudou F, Humbert S (2016) The Biology of Huntingtin. Neuron 89(5):910–926. 10.1016/j.neuron.2016.02.003 - PubMed
    1. Roze E, Saudou F, Caboche J (2008) Pathophysiology of Huntington’s disease: from huntingtin functions to potential treatments. Curr Opin Neurol 21(4):497–503. 10.1097/WCO.0b013e328304b692 - PubMed

MeSH terms

Substances