Review
. 2025 Jul 25;15(16):8259-8319.
doi: 10.7150/thno.116153. eCollection 2025.

Engineered upconversion nanoparticles for breast cancer theranostics

Affiliations
Review

Engineered upconversion nanoparticles for breast cancer theranostics

Shijing Wang et al. Theranostics. .

Abstract

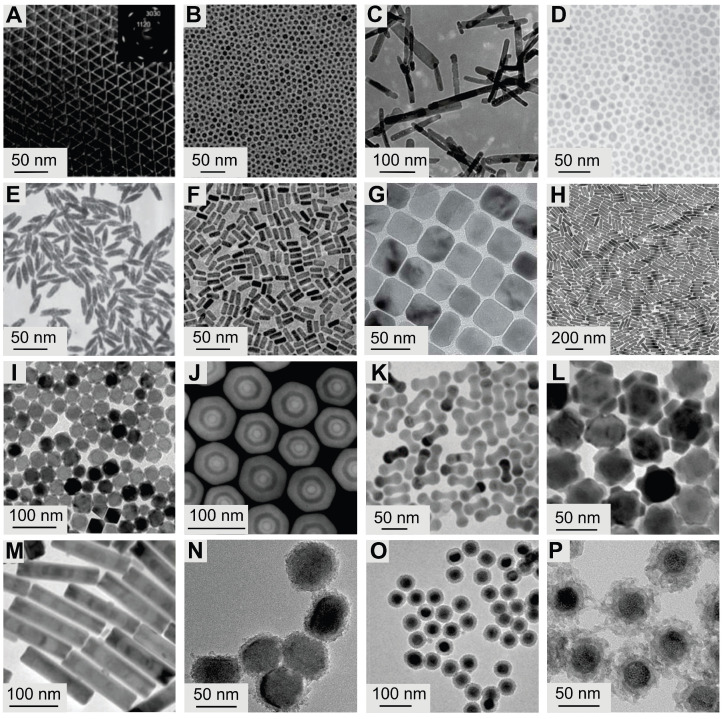
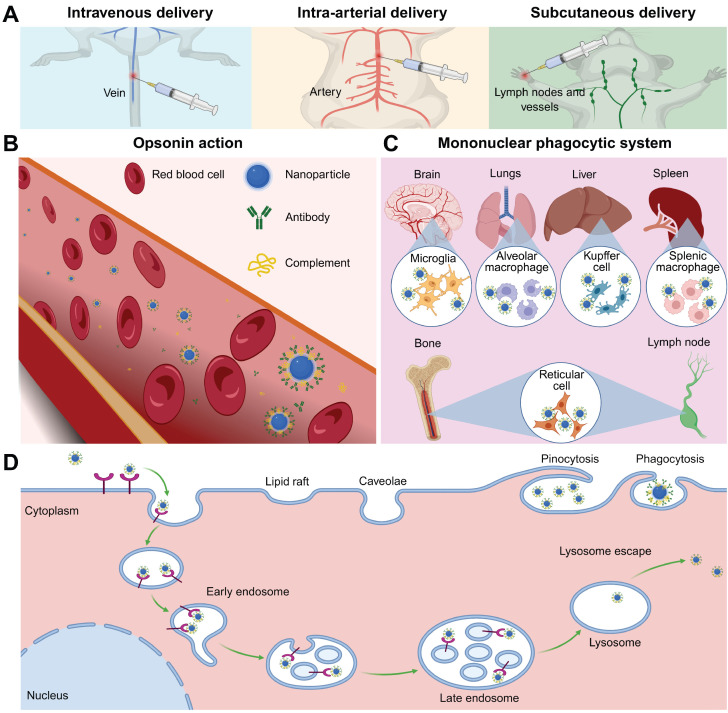
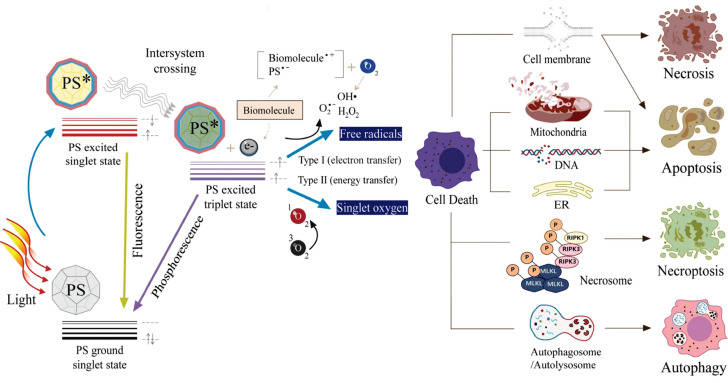
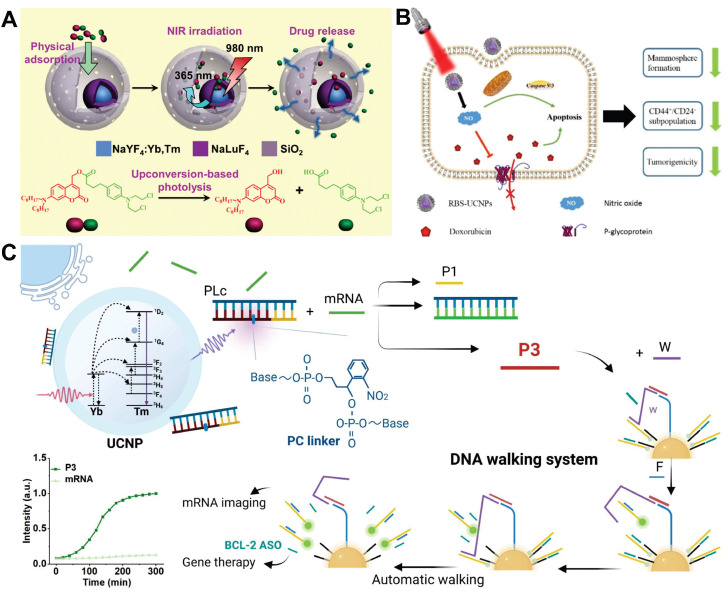
Breast cancer (BC) remains the most prevalent cancer among women and a leading cause of cancer-related mortality worldwide, posing a significant threat to public health. Rare earth (RE)-doped upconversion nanoparticles (UCNPs) have emerged as a promising nanoplatform for BC management, owing to their exceptional photophysical properties and design flexibility. Unlike conventional fluorescent probes, engineered UCNPs absorb near-infrared (NIR) light, enabling deep tissue penetration while mitigating tissue damage and spontaneous fluorescence interference. Furthermore, through core-shell structure engineering and functionalization, multiple diagnostic and therapeutic modules can be integrated within a single NP, enabling theranostic applications for BC. This review comprehensively summarizes recent advances in engineered UCNPs for BC theranostics. It begins by introducing the luminescence mechanisms, controllable synthesis methods, and surface modification strategies of UCNPs. Next, it explores the fundamental biological effects of UCNPs, including biodistribution, metabolic pathways, and biotoxicity. Subsequently, we systematically review applications of engineered UCNPs in BC molecular imaging, biomarker detection, phototherapy, smart drug/gene delivery, and immunotherapy. Finally, current challenges and clinical translation prospects of UCNPs are discussed.

Keywords: biomarker detection; breast cancer; delivery; immunotherapy; molecular imaging; phototherapy; theranostics; upconversion nanoparticles.


Conflict of interest statement

Competing Interests: The authors have declared that no competing interest exists.

Figures

Figure 1
Figure 1
(A) Pie charts show the distribution of cases and deaths among the three top cancers affecting females in 2022. The size of each segment precisely reflects the proportion of the total number of cases or deaths. (B) Molecular subtypes of BC. Clinical status of strategies for BC diagnosis (C) and treatment (D). (E) Different types of UCNP-based designs for strategies in the diagnosis and treatment of cancer. Created with BioRender.com.
Figure 2
Figure 2
(A) Ionic radius and valence configuration of RE. From La3+ to Lu3+, the number of electrons on the 4f orbitals increases with increasing atomic number. The electron configurations of La3+, Gd3+, and Lu3+ show empty, half-filled, and completely filled 4f orbitals, respectively. Adapted with permission from , copyright 2022, American Chemical Society. (B) Simplified energy level diagrams of lanthanide ions for a basic upconversion process. The 4f N configuration of lanthanide ions splits into multiple energy sublevels due to the effects of the coulombic (Hc), spin-orbit (Hso) and crystal-field (Hcf) interactions. The energy levels are denoted as 2S+1LJ, where S, L, and J stand for total spin, orbital, and total angular momentum quantum numbers. (C) Schematic illustrations for UCNPs and the tipical energy transfer process. (D) Schematic diagrams of six upconversion processes. Created with BioRender.com. λex: excitation spectrum; λem: emission spectrum; ESA: excited state absorption; ETU: energy transfer upconversion; CUC: cooperative upconversion; CR: cross-relaxation; PA: photon avalanche; EMU: energy migration upconversion.
Figure 3
Figure 3
(A) Schematic diagram of the core-shell structures. Adapted with permission from , copyright 2015, Royal Society of Chemistry. (B) The shell-thicknesses dependent upconversion emission spectra of NaErF4@NaYF4 NPs. Reproduced with permission , copyright 2021, under a Creative Commons CC BY license. (C) Schematic illustrations of dye sensitized upconversion in the core (S, sensitizer; A, activator) (left) and the core-shell structure (right). Adapted with permission from , copyright 2021, American Chemical Society. (D) A summary of the upconversion transitions of RE ion, covering a broad range of wavelengths from the UV to the NIR. Created with BioRender.com. (E) UCL of core-shell NPs with different Eu3+/Tb3+ doping concentrations under 980 nm excitation. Adapted with permission from , copyright 2011, Springer Nature Limited. (F) Schematic illustration of the sandwich core-shell nanostructure. Adapted with permission from , copyright 2021, Chinese Chemical Society.
Figure 4
Figure 4
Typical transmission electron microscope images of UCNPs. (A) LaF3 (Adapted with permission from , copyright 2005, American Chemical Society), (B) NaYF4 (Adapted with permission from , copyright 2006, WILEY-VCH Verlag GmbH & Co. KGaA, Weinheim) and (C) Gd2O3 (Adapted with permission from , copyright 2012, Elsevier Ltd. All rights reserved) NPs synthesized by thermal decomposition. (D) NaYF4 (Adapted with permission from , copyright 2005, Springer Nature Limited), (E) YF3 (Adapted with permission from , copyright 2005, Springer Nature Limited), and (F) NaGdF4 (Adapted with permission from , copyright 2016, American Chemical Society) nanocrystals synthesized by hydrothermal/solvothermal strategy. (G) NaScF4 (Adapted with permission from , copyright 2013, Royal Society of Chemistry) and (H) KYb2F7 (Adapted with permission from , copyright 2013, Springer Nature Limited) nanocrystals synthesized by coprecipitation. (I) LiLuF4@LiLuF4 (Adapted with permission from, copyright 2014, WILEY-VCH Verlag GmbH & Co. KGaA, Weinheim) NPs synthesized by seed-mediated heat-up. (J) GdF4@NaYF4@NaGdF4@NaYF4@NaGdF4 (Adapted with permission from , copyright 2016, WILEY-VCH Verlag GmbH & Co. KGaA, Weinheim) nanocrystals synthesized by successive layer-by-layer method. (K) NaGdF4@NaYF4 nano-dumbbells, (L) NaYF4@NaGdF4@NaNdF4 flower-shaped nanocrystals, (M) NaYF4@NaGdF4 bamboo-like nanorods (Adapted with permission from , copyright 2016, under a Creative Commons CC BY license). (N) NaYF4@TiO2 (Adapted with permission from , copyright 2020, Elsevier Ltd. All rights reserved), (O) NaYF4@NaYF4@SiO2 (Adapted with permission from , copyright 2020, The Society of Powder Technology Japan. Published by Elsevier B.V. and The Society of Powder Technology Japan. All rights reserved), and (P) NaYF4@mSiO2 (Adapted with permission from , copyright 2022, American Chemical Society) NPs synthesized by nonepitaxial growth.
Figure 5
Figure 5
(A) Typical surface modification strategies applicable to UCNPs. (B) Scheme of covalent conjugation of UCNPs with biomolecules. Created with BioRender.com.
Figure 6
Figure 6
(A) Common delivery strategies. (B) Opsonin action and (C) phagocytosed by mononuclear phagocytic system. (D) Schematic diagram of endocytosis. Created with BioRender.com.
Figure 7
Figure 7
Size-dependent excretion of NPs in the kidneys and liver. (A) Kidney structures and excretion of NPs in the kidney. (B) Liver structures and excretion of NPs in the liver. Created with BioRender.com.
Figure 8
Figure 8
Passive and active targeting mechanism of NP on cancer cells. Created with BioRender.com.
Figure 9
Figure 9
The identification and surgery of tumors in tumor-bearing mice under NIR-IIb fluorescence imaging navigation. (A) Representative bioluminescence (left) and NIR-IIb (right) images of a multiple microtumor mouse model. (B) Ex vivo NIR-IIb fluorescence imaging of resected pieces. (C) H&E staining of resected pieces. (D) Representative images during NIR-IIb fluorescence-guided surgery. (E) Bioluminescence images of mice before and 14 days after surgery under white-light (left) and NIR-IIb fluorescence guidance (right). (F) The corresponding average radiation of region of interest. Adapted with permission from , copyright 2022, under a Creative Commons CC BY license.
Figure 10
Figure 10
(A) In vivo dual-modal imaging based on the NPs. NIR-II fuorescence images of 4T1-tumor-bearing mice at 1060 and 1340 nm after NPs administration (top); T1-weighted MRI of breast tumor after injection with NPs for 0, 5, 15, 30, 60, 90, 120, and 240 min. The tumor area was marked with arrow (bottom). Adapted with permission from , copyright 2021, under a Creative Commons CC BY license. (B) In vivo multimodality imaging and biodistribution of Y1Rs-ligand-functionalized nanocomposites. (i) UCL, (ii) MRI, and (iii) CT imaging of MCF-7 tumor-bearing nude mice after the intravenous injection of nanocomposites at 5 min, 6 h, 12 h, and 24 h; (iv) biodistribution of nanocomposites in the main organs of MCF-7 tumor-bearing mice at 12 h post-injection. Adapted with permission from , copyright 2018, Royal Society of Chemistry. (C) The schematic of the preparation process of the modified RBC-UCNPs and their applications of MRI, UCL imaging and PET imaging in TNBC bearing mice. Adapted with permission from , copyright 2020, Royal Society of Chemistry.
Figure 11
Figure 11
(A) Dynamic distribution of UCNPs in mice after footpad injection. (i) In vivo UCL image of mice after injection of the surface-modified UCNPs. LV, lymphatic vessel; SLN, sentinel lymph node; R, reflected secondary; (ii) In vivo UCL imaging of lymph node in the same mouse at different post-injection times. Mice were subcutaneously injected in the forepaw footpad with the UCNPs; (iii) H&E staining and corresponding UCL images of dissected axillary lymph nodes from the mice treated with UCNPs. The lymph nodes were obtained on 1, 6, and 30 days after the injections. Adapted with permission from , copyright 2016, under a Creative Commons CC BY license. (B) UCL images captured before and at 1.5 h after intravenously delivering the nanoprobes (i) and mother NPs (ii), respectively, into nude mice bearing metastatic lymph nodes as indicated by the white arrows; ex vivo UCL images of the main organs and lymph nodes captured right after acquiring the above images (iii, iv) (H, heart; B, brain; L, liver; S, spleen; LU, lung; K, kidney; ST, stomach; LI, large intestine; SI, small intestine; LN, lymph node), together with the quantified biodistribution profile (vi). Adapted with permission from , copyright 2018, Royal Society of Chemistry. (C) Fluorescence (top) and PET imaging (bottom) of metastatic lymph nodes (red arrow: lymphatic metastasis, yellow arrow: injection site in foot pad). Adapted with permission from , copyright 2022, under a Creative Commons CC BY license. (D) In situ protease secretion visualization and metastatic lymph nodes imaging via a cell membrane-anchored upconversion nanoprobe. (i) Confocal microscopy images of upconversion nanoprobe-anchored MDA-MB-231 cells, MCF-7 cells, and inhibitor pre-treated MDA-MB-231 cells upon lipopolysaccharide activation; (ii) Fluorescence images and (iii) average fluorescence intensities of Cyanine 3 at 580 nm from metastatic lymph node, normal lymph node, and metastatic lymph node with the inhibitor in living mice before (0 h) and 0.5, 1, 2, and 4 h post NPs injection. Adapted with permission from , copyright 2021, American Chemical Society.
Figure 12
Figure 12
(A) Surface amino modifications of green, blue, and red single-band UCNPs and antibody conjugates for multiplexed in situ molecular mapping of BC biomarkers PR, ER, and HER2. Adapted with permission from , copyright 2015, under a Creative Commons CC BY license. (B) (i) Working principle of CA153 biosensor based on FRET; (ii) UCL spectrum and (iii) the corresponding UCL intensity at 475 nm of the nanoprobe after reaction with various concentrations of CA153 in 100-fold diluted human serum. Adapted with permission from , copyright 2022, under a Creative Commons CC BY license. (C) Schematic illustration of the preparation of lock-like DNA (top) and upconversion nanoprobe (bottom), and application in monitoring microRNA-21 in living cells. Adapted with permission from , copyright 2018, WILEY-VCH Verlag GmbH & Co. KGaA, Weinheim.
Figure 13
Figure 13
Mechanism of photodynamic reactions (either type I or type II) and cell death pathways in the process of PDT. Adapted with permission from , copyright 2021, under a Creative Commons CC BY license.
Figure 14
Figure 14
(A) Schematic illustration of preparation of NPs and their applications in bioimaging and PDT of deep-seated tumors upon NIR laser illumination, in an in vitro three-dimensional cancer cell spheroid and in a murine tumor model, respectively. (B) The morphology of NPs under transmission electron microscopy. (C) Biodistribution of NPs in tumor-bearing mice after intravenous injection of NPs (30 mg/kg) at different times. Black circles indicate the tumor. (D) Ex vivo fluorescence imaging of various organs and tumor tissues from mice intravenously injected with NPs. The mice were sacrificed at 12 h post-injection. (E) Biodistribution of NPs in tumor-bearing mice 8 h after intravenous injection of NPs (30 mg/kg) without or with blocking the receptors. Red circles indicate the tumor. (F) Growth curves of tumors in laser PDT, white light PDT, NP-only, laser-only and control groups, respectively, and NPs were intravenously injected into tumors with an initial tumor volume of 120 mm3. Adapted with permission from , copyright 2019, under a Creative Commons CC BY license.
Figure 15
Figure 15
(A) A schematic illustration showing the composition of nanocomposites and the concept of in vivo imaging-guided magnetically targeted photothermal therapy. (B) Representative In vivo UCL images of 4T1 tumor-bearing Balb/c mice taken 2 h after injection of NPs under the tumor-targeted magnetic filed (top) and without the magnetic field (bottom). (C) Representative In vivo T2-weighted MRI images of 4T1 tumor-bearing mice with and without magnetic targeting acquired 2 h after injection of NPs. (D) The growth of 4T1 tumors in different groups of mice after treatment. (E) Survival curves of mice bearing 4T1 tumor after various treatments indicated. (F) Representative photos of mice after various treatments indicated. Adapted with permission from , copyright 2011, Elsevier Ltd. All rights reserved.
Figure 16
Figure 16
(A) Schematic illustration of the NIR-regulated upconversion-based phototrigger-controlled drug-release device and the photolysis of the prodrug under upconversion emission from the UCNPs. Adapted with permission from , copyright 2013, WILEY-VCH Verlag GmbH & Co. KGaA, Weinheim. (B) Schematic diagram of the synergistic treatment of NO released from NPs and DOX. Adapted with permission from , copyright 2017, Science China Press. Published by Elsevier B.V. and Science China Press. All rights reserved. (C) Illustration of Intracellular NIR photoactivatable NPs can released P3 DNA in the prescence of mRNA, and P3 can activated downstream operation of entropy-driven DNA walking system for survivin mRNA imaging and gene therapy with highly spatiotemporal resolution. The fluorescence dynamic curve on the left showed the P3-initiated DNA walking system. Adapted with permission from , copyright 2023, Elsevier Ltd. All rights reserved.
Figure 17
Figure 17
(A) Scheme illustration of the theranostic bone-targeting Gd (III)-doped UCNPs. (B) Western blot of RANKL, OPG, and sclerostin in MLOY-4 cells treated with varying NPs. (C) Murine bone marrow monocytes were treated with various interventions for 7 consecutive days. TRAP staining was used to indicate mature multinucleated osteoclast cells. (D) Representative μCT tomography of bone metastasis in specimens from nude mice treated with various NPs after 2/4 weeks. Red arrows indicate the osteolysis lesions. Adapted with permission from , copyright 2017, American Chemical Society.
Figure 18
Figure 18
(A) Schematic illustration of antigenloaded UCNPs for DC stimulation, tracking and vaccination in DC based immunotherapy. Bipolymer-coated UCNP-PEG-PEI (UPP) NPs were synthesized and loaded with ovalbumin (OVA) via electrostatic interaction to form UPP@OVA complexes. These complexes were efficiently internalized by DCs, inducing DC maturation and cytokine secretion. The UCL property of UCNPs enabled highly sensitive in vivo tracking of DC migration, demonstrating homing of labeled DCs to draining lymph nodes. Compared with free OVA-pulsed DCs, UPP@OVA-pulsed DC vaccines significantly enhanced T cell proliferation, interferon-γ secretion, and cytotoxic T lymphocyte mediated responses, providing a novel trackable strategy for immunotherapy. Adapted with permission from , copyright 2015, American Chemical Society. (B) Schematic illustration of both fabrication and mechanism of NIR-triggered antigen-capturing nanoplatform for synergistic photo-immunotherapy. The NIR-triggered antigen-capturing nanoplatform was constructed via self-assembly of PEG and indocyanine green onto the oleate-capped UCNPs, followed by remote loading of RB. Upon NIR laser activation, the photodynamic therapy efficiency of NPs was significantly enhanced by indocyanine green modification, while simultaneously achieving selective PTT. Next, tumor-derived protein antigens arising from NPs based phototherapy can be captured and retained in situ, which increases the effects of antigen uptake by antigen-presenting cells to induce a tumor-specific immune response. Adapted with permission from , copyright 2019, under a Creative Commons CC BY license.
Figure 19
Figure 19
Challenges in nanomedicine clinical translation. Key translational and industrial aspects of nanomedicine product development are depicted. Challenges are traditionally approached in a bottom-up manner. However, also considering challenges in a top-down manner, from the vantage point of end-users, with commercial, practical, and clinical feasibility firmly in mind, is considered to be important for ensuring success. The top-down analysis allows for the identification-from the initiation of the clinical translation process onwards-of the most important issues that can be encountered along the way, triggering proactive thinking and planning to overcome potential challenges already at early stages. Adapted with permission from , copyright 2020, under a Creative Commons CC BY license.

Similar articles

References

    1. Bray F, Laversanne M, Sung H, Ferlay J, Siegel RL, Soerjomataram I. et al. Global cancer statistics 2022: GLOBOCAN estimates of incidence and mortality worldwide for 36 cancers in 185 countries. CA Cancer J Clin. 2024;74:229–63. - PubMed
    1. Kim J, Harper A, McCormack V, Sung H, Houssami N, Morgan E. et al. Global patterns and trends in breast cancer incidence and mortality across 185 countries. Nat Med. 2025;31:1154–62. - PubMed
    1. Sung H, Ferlay J, Siegel RL, Laversanne M, Soerjomataram I, Jemal A. et al. Global cancer statistics 2020: GLOBOCAN estimates of incidence and mortality worldwide for 36 cancers in 185 countries. CA Cancer J Clin. 2021;71:209–49. - PubMed
    1. Sun Y-S, Zhao Z, Yang Z-N, Xu F, Lu H-J, Zhu Z-Y. et al. Risk factors and preventions of breast cancer. Int J Biol Sci. 2017;13:1387–97. - PMC - PubMed
    1. Heck L, Herzen J. Recent advances in X-ray imaging of breast tissue: from two- to three-dimensional imaging. Phys Medica PM Int J Devoted Appl Phys Med Biol Off J Ital Assoc Biomed Phys AIFB. 2020;79:69–79. - PubMed

Substances