. 2025 Aug 13;129(33):15097-15108.
doi: 10.1021/acs.jpcc.5c03644. eCollection 2025 Aug 21.

Engineering Nanoparticle Surface Amphiphilicity: An Integrated Computational and Laser Desorption Ionization Study of Controlled Ligand Self-Assembly

Affiliations

Engineering Nanoparticle Surface Amphiphilicity: An Integrated Computational and Laser Desorption Ionization Study of Controlled Ligand Self-Assembly

Jacob Kennedy et al. J Phys Chem C Nanomater Interfaces. .

Abstract

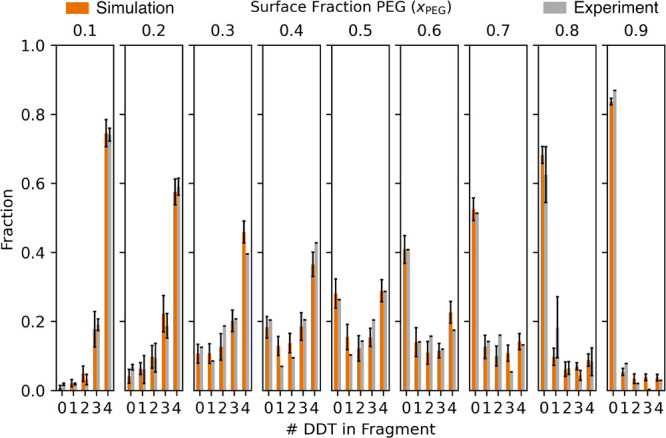
Multiligand monolayers can self-organize into advantageous interfacial patterns that govern nanoparticle (NP) properties. Polyethylene glycol (PEG) is widely incorporated into self-assembled monolayers to enhance biocompatibility, particularly in drug delivery applications. Previous studies demonstrate that monolayer phase separation can be controlled by leveraging the energetic and entropic driving forces acting on ligands in the design of amphiphilic surfaces. In this work, we extend an integrated experimental and simulation framework to investigate the self-assembly of dodecanethiol (DDT), a long hydrophobic alkanethiol, with 2-ethoxyethane-1-thiol, a short hydrophilic PEG-thiol, as a function of their surface composition on ultrasmall gold NPs. The PEG-DDT Au NPs were synthesized via ligand exchange. Integrated MALDI-MS experiments and configurationally biased Monte Carlo simulations were used to analyze and predict the local ordering of the surface ligands. The MALDI-MS fragment distributions obtained from experiment and simulation show quantitative agreement, and both indicate that the PEG-DDT ligands undergo phase separation, resulting in NP monolayers with patchy to Janus-like hydrophilic and hydrophobic ligand domains. Further, the domain size was found to increase proportionally with the surface fraction of each ligand, thereby demonstrating the ability to tune patch sizes in amphiphilic monolayers by controlling the surface composition.


Figures

1
1
SSR values for all three initial configuration data sets (6 trials initially Janus, Random, and Striped) for each surface fraction (x PEG). The markers report the average of 60 configurations from the 6 trials in each subset all initialized in the corresponding morphology and the error bars report the standard deviation of those 60 configurations’ approximated fragment distributions. The boundary of the shaded region represents the average SSR value of 50 random, perfectly Janus, morphologies at each surface fraction and thus represents the upper bound for each x PEG composition. The dotted lines above and below the solid line represent one standard deviation. SSR convergence is observed across all PEG surface fractions examined which suggests that the simulated morphologies have all equilibrated.
2
2
NP shape and size distribution from STEM. (a) Representative STEM image of gold NPs with dodecanethiol (DDT) and 2-ethoxyethane-1-thiol (PEG) monolayer. (b) Histogram of the particle sizes derived from STEM measurements. For a total of 100 counted particles, the median diameter is 2.8 nm with a standard deviation of 0.3 nm.
3
3
Schematic showing how experiment and simulation are compared via MALDI-MS fragment distributions. (a) Representative raw MALDI-MS spectrum of a PEG-DDT Au NP with of x PEG = 0.47. Au4L4 fragment peaks are represented by 4 beads, one for each ligand, with gray beads representing DDT and red beads representing PEG. (b) Illustration of method to extract expected MALDI-MS distributions from the atomistic simulations. Here, an equilibrated snapshot of the corresponding x PEG = 0.50 is shown. Ovito was used to visualize the snapshots obtained from simulation. The carbon in the ligands is shown in dark gray, sulfur in yellow, oxygen in red, and the Au NP core is gold. To build up the expected distributions, the equilibrated monolayer is randomly sampled 50,000× for simulated 4-ligand fragment clusters (circled in red). Each cluster is then classified by the number of DDT, resulting in a normalized fragment distribution (d) which can be then directly compared to experiment (c). The distributions of the experimental (c) and computational (d) results are subsequently compared to the binomial distribution for the corresponding ligand surface ratio. A quantitative comparison is then made by comparing the experimental and simulation SSR values. Adapted from reference . Copyright 2018 American Chemical Society.
4
4
Comparisons of the normalized MALDI-MS ligand distributions between the closest experimental distribution (gray) to the average simulated distribution (orange) for the PEG-DDT Au NPs. Nine surface fractions were investigated, ranging from x PEG = 0.10 – 0.90. The closest experimental distribution was chosen for comparison unless multiple experimental distributions fell within ± 0.015 x PEG in which case they were averaged. The averaged distributions included x PEG sim = 0.1, 0.2, and 0.8 with 3, 4, and 2 contributing experimental fragment distributions, respectively. Each experimentally averaged distribution is shown with standard deviation represented in the error bars (black). For simulation, the bar heights report the average of the final 10 configurations for each trial (180 total fragment distributions) and the error bars represent the standard deviation observed among the 180 configurations. The SSRexp‑sim values for each x PEG, which report on the agreement between experiment and simulation, are listed in SI Table S1.
5
5
Experimental (navy stars) and simulation (orange circles) SSR values as a function of PEG surface fraction. While the experimental results are spread continuously across the range of x PEG (the experimental determination of x PEG is described in the Methods section), the simulations were conducted at discrete PEG surface fractions ranging from 0.1 to 0.9. Eighteen trials were run for each surface fraction with a third initialized in a Janus morphology, another third in a random morphology, and the remaining third in a striped morphology (stripes were 5 Å wide). The orange circle markers represent the simulation average SSR obtained from the 18 trials for each surface fraction data set and the error bars report the standard deviation. Representative snapshots, chosen randomly, from simulation are shown above the corresponding PEG surface fraction for added clarity. (See SI Figure S1 for individual simulation results at each x PEG.).
6
6
Ratio of the average SSRsim and the average SSRJanus as a function of x PEG. This metric reports on the degree of Janus character by comparing the observed SSRsim values to that of a perfectly Janus counterpart, SSRJanus. The standard deviation is propagated from the quotient of the two averages and presented in the error bars, and the solid line was added to aid viewing. Representative snapshots were obtained from the equilibrated CBMC simulations and are included above the plot in order of increasing x PEG.
7
7
Number-weighted average patch size for both DDT (navy) and PEG (orange) patches as a function of the PEG surface fraction (indicated by the vertical dashed line that the corresponding boxes are closest to). The solid lines represent the total number of the corresponding ligand type (DDT - navy; PEG - orange) included in the simulation trials at each x PEG. Patch sizes were computed from the final 10 CBMC equilibrium monolayer configurations of each of the 18 trials per surface fraction (180 configurations were considered at each x PEG). The number-weighted average patch sizes of PEG and DDT are reported as box-plots with the gray line within each box being the median, the bounds of each box report the first and third quartile, and the whiskers indicate the minimum and maximum patch size averages within 1.5x of the interquartile range (IQR). Number-weighted patch sizes outside 1.5·IQR are reported as outliers (open circles). The number-weighted average patch sizes are also reported as the covered fraction of the NP surface area in Figure S1 of the Supporting Information.

Similar articles

  • Prescription of Controlled Substances: Benefits and Risks.
    Preuss CV, Kalava A, King KC. Preuss CV, et al. 2025 Jul 6. In: StatPearls [Internet]. Treasure Island (FL): StatPearls Publishing; 2025 Jan–. 2025 Jul 6. In: StatPearls [Internet]. Treasure Island (FL): StatPearls Publishing; 2025 Jan–. PMID: 30726003 Free Books & Documents.
  • Home treatment for mental health problems: a systematic review.
    Burns T, Knapp M, Catty J, Healey A, Henderson J, Watt H, Wright C. Burns T, et al. Health Technol Assess. 2001;5(15):1-139. doi: 10.3310/hta5150. Health Technol Assess. 2001. PMID: 11532236
  • Comparison of self-administered survey questionnaire responses collected using mobile apps versus other methods.
    Marcano Belisario JS, Jamsek J, Huckvale K, O'Donoghue J, Morrison CP, Car J. Marcano Belisario JS, et al. Cochrane Database Syst Rev. 2015 Jul 27;2015(7):MR000042. doi: 10.1002/14651858.MR000042.pub2. Cochrane Database Syst Rev. 2015. PMID: 26212714 Free PMC article.
  • Short-Term Memory Impairment.
    Cascella M, Al Khalili Y. Cascella M, et al. 2024 Jun 8. In: StatPearls [Internet]. Treasure Island (FL): StatPearls Publishing; 2025 Jan–. 2024 Jun 8. In: StatPearls [Internet]. Treasure Island (FL): StatPearls Publishing; 2025 Jan–. PMID: 31424720 Free Books & Documents.
  • Electrophoresis.
    Sonagra AD, Zubair M, Dholariya SJ. Sonagra AD, et al. 2025 Jul 14. In: StatPearls [Internet]. Treasure Island (FL): StatPearls Publishing; 2025 Jan–. 2025 Jul 14. In: StatPearls [Internet]. Treasure Island (FL): StatPearls Publishing; 2025 Jan–. PMID: 36251838 Free Books & Documents.

References

    1. Pezzato C., Maiti S., Chen J. L.-Y., Cazzolaro A., Gobbo C., Prins L. J.. Monolayer protected gold nanoparticles with metal-ion binding sites: functional systems for chemosensing applications. Chem. Commun. 2015;51:9922–9931. doi: 10.1039/C5CC00814J. - DOI - PubMed
    1. Thanh Cong V., Houng J. L., Kavallaris M., Chen X., Tilley R. D., Justin Gooding J.. How can we use the endocytosis pathways to design nanoparticle drug-delivery vehicles to target cancer cells over healthy cells? Chem. Soc. Rev. 2022;51:7531–7559. doi: 10.1039/D1CS00707F. - DOI - PubMed
    1. Kamerkar S., LeBleu V. S., Sugimoto H., Yang S., Ruivo C. F., Melo S. A., Lee J. J., Kalluri R.. Exosomes facilitate therapeutic targeting of oncogenic KRAS in pancreatic cancer. Nature. 2017;546:498–503. doi: 10.1038/nature22341. - DOI - PMC - PubMed
    1. Grisel R., Weststrate K.-J., Gluhoi A., Nieuwenhuys B. E.. Catalysis by Gold Nanoparticles. Gold Bulletin. 2002;35:39–45. doi: 10.1007/BF03214836. - DOI
    1. Hoff S. E., Di Silvio D., Ziolo R. F., Moya S. E., Heinz H.. Patterning of self-assembled monolayers of amphiphilic multisegment ligands on nanoparticles and design parameters for protein interactions. ACS Nano. 2022;16:8766–8783. doi: 10.1021/acsnano.1c08695. - DOI - PubMed

LinkOut - more resources