. 2025 Jun 2;28(9):112804.
doi: 10.1016/j.isci.2025.112804. eCollection 2025 Sep 19.

Blood immunomap for prediction of responses to anti-PD-1 immunotherapy in metastatic non-small cell lung cancer

Affiliations

Blood immunomap for prediction of responses to anti-PD-1 immunotherapy in metastatic non-small cell lung cancer

Maria Semitekolou et al. iScience. .

Abstract

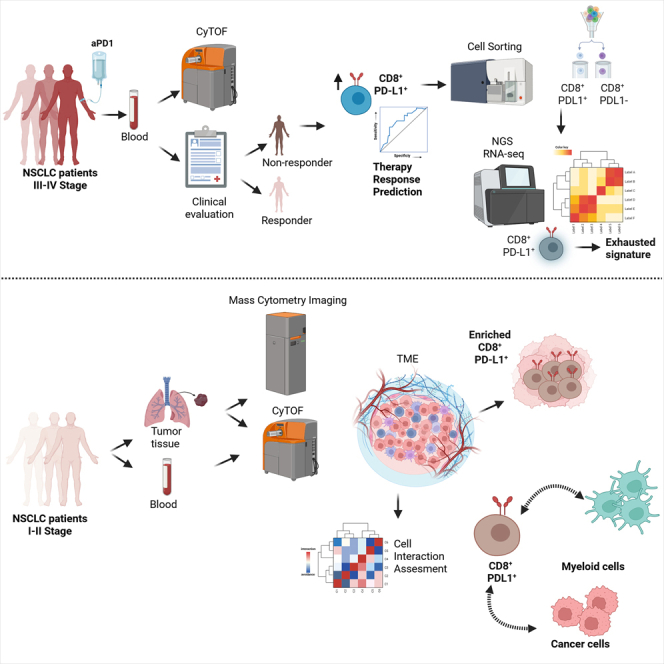
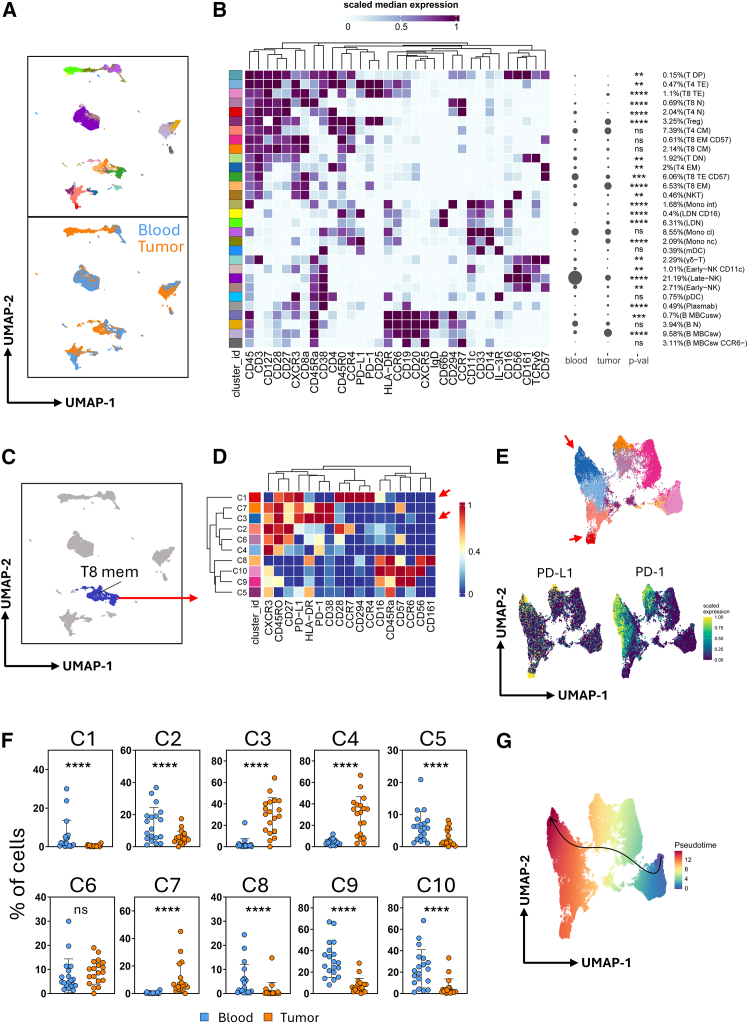
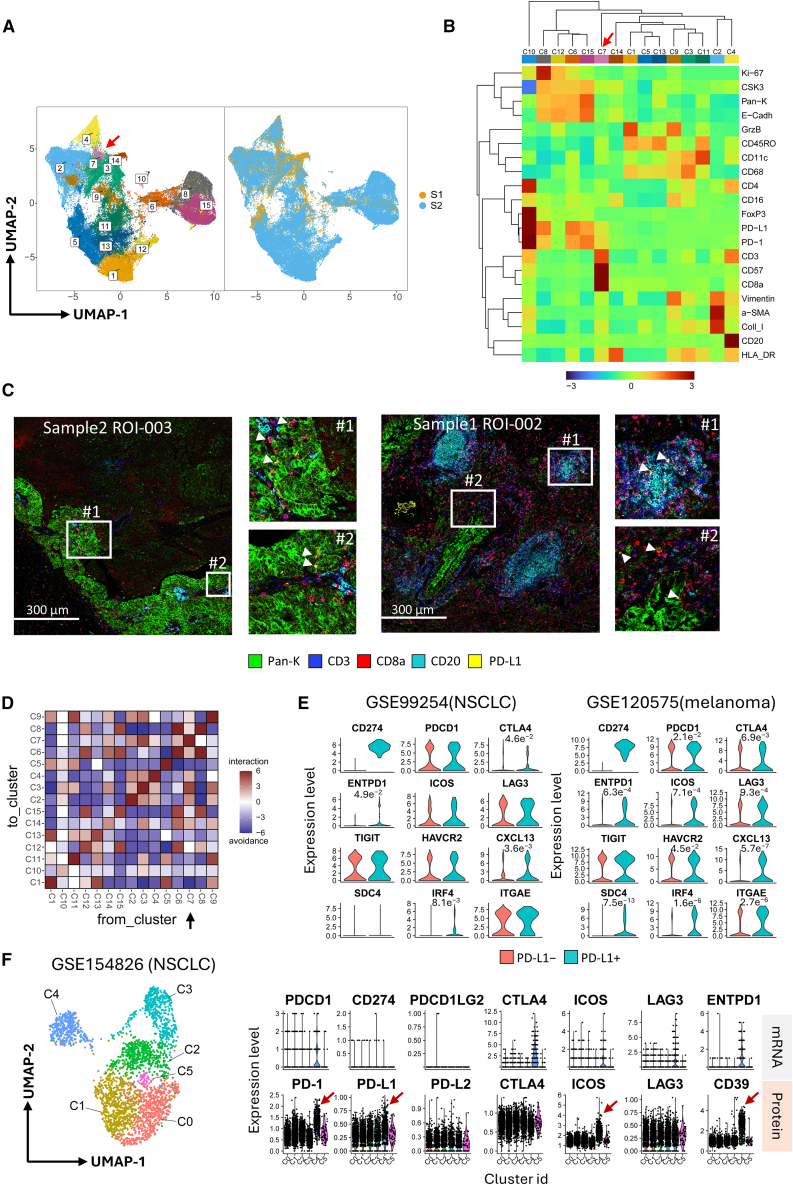
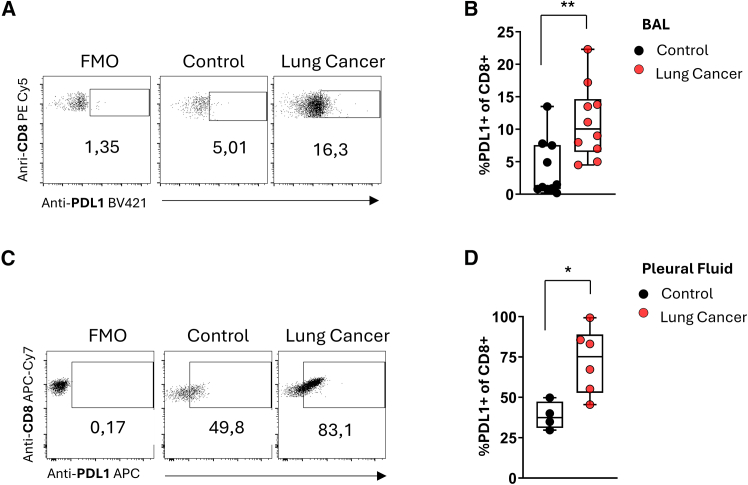
The identification of circulating predictors of response to ICB therapy is vital as very few of them meet the demands of the clinic. Herein, by using high-dimensionality mass cytometry, we designed a blood immunomap in metastatic NSCLC individuals who underwent anti-PD-1 treatment. We identified heightened frequencies of CD8+PD-L1+ T cells in non-responders compared to responders. Notably, imaging mass cytometry data revealed that CD8+PD-L1+ T cells were enriched in tumor biopsies, pleural infusions, and BAL of early-stage NSCLC individuals, proposing this cells subset as candidate not only for the advanced but also for early disease detection. Transcriptomic analysis unveiled that CD8+PD-L1+ T cells displayed an exhausted phenotype related to their increased frequencies to non-responders to immunotherapy, and gene signatures correlated with the overall survival of an independent cohort. Overall, our study pinpoints immune-related events which may benefit the quest for detection of predictive biomarkers of immunotherapy responses.

Keywords: Cancer; Transcriptomics.


Conflict of interest statement

The authors declare no competing interests.

Figures

None
Graphical abstract
Figure 1
Figure 1
Study outline (A) PBMCs from NSCLC patients (stage III-IV) before the initiation of anti-PD-1 immunotherapy were analyzed with CyTOF. Patients were clinically evaluated at 12 months and classified as responders (R) or non-responders (NR) to immunotherapy. Computational cytometry analysis tools were used to construct an immunomap and select key features for immunotherapy response prediction and further investigation with flow cytometry and RNA-seq. (B) PBMCs and lung tumor from NSCLC patients (stage I-II) were analyzed with CyTOF and IMC. BALF and PF was also collected from individuals with thoracic malignancies, bronchiectasis or pleural infections for flow cytometry analysis. Created in BioRender (https://BioRender.com/t4ein2a).
Figure 2
Figure 2
Identification of peripheral blood immune signatures in NSCLC patients prior to the initiation of immunotherapy (A) UMAP plot of concatenated blood circulating CD45+ cells from responder (R; n = 24) and non-responder (NR; n = 26) samples from patients with NSCLC prior ICB. (B) Heatmap of the median marker intensities of the 33 lineage markers across the 24 cell populations obtained using the FlowSOM algorithm after manual metacluster merging. The colors in the cluster_id column corresponds to those used for labeling the UMAP plot clusters as in a. The heatmap colors represent the median arcsinh marker expression (scaled 0–1) calculated from cells across all samples, with blue indicating lower expression and red indicating higher expression. The light gray bar along the rows (clusters) and the values in brackets indicate the relative sizes of the clusters. (C) Dot plots show the frequencies (% of live singlet PBMCs) of identified clusters among R (n = 24) and NR (n = 26). The central bar represents the mean ± SEM. Generalized linear mixed model (GLMM) test was used for the statistical analysis. Adjusted P-values are reported in the figure. (D) Heatmap of the median marker intensities of the 17 lineage markers across the 12 cell populations obtained using the FlowSOM algorithm during the reclustering of T8 cells. (E) Dot plots display the frequencies of T8 clusters in R and NR. The central bar represents the mean ± SEM. Statistical analysis was performed using a generalized linear mixed model (GLMM) test, with adjusted p-values reported in the figure. (F) UMAP plot of R and NR T8 cells embedded with PENCIL prediction, confidence score of PENCIL prediction and FlowSOM clusters. In gray non classified cells (rejected), in blue cells associated with ICB response (R) and in red cells associated with ICB non-response. (G) Stability path graphs denote clusters of T8 cells selected by Stabl. The data-driven computed reliability threshold θ is indicated by a dotted line. Features selected by Stabl (red lines) are shown.
Figure 3
Figure 3
Distinct subsets of CD8+ PD-L1+ cells are present in the periphery and lung tissue of NSCLC patients (A) UMAP plot of concatenated CD45+ T cells from peripheral blood (n = 19) and tumor (n = 19) samples from early-stage NSCLC patients color-coded by FlowSOM clusters (Top panel) or tissue origin (Bottom panel). (B) Heatmap of the median marker intensities of the 33 lineage markers across the 30 cell populations obtained using the FlowSOM algorithm after manual metacluster merging. The colors in the cluster_id column correspond to those used for labeling the UMAP plot clusters as in A. The heatmap colors represent the median arcsinh marker expression (scaled 0–1) calculated from cells across all samples, with blue indicating lower expression and red indicating higher expression. The light gray balloon plot along the rows (clusters) indicates the relative sizes of the clusters among blood and tumor tissue. (C) UMAP plot as in a depicting the selected T8 memory cells (blue dots). (D) Heatmap of the median marker intensities of the 17 lineage markers across the 10 cell populations obtained using the FlowSOM algorithm during the reclustering of T8 memory cells. (E) UMAP plot of T8 memory cells, with the top panel color-coded by FlowSOM clusters and the bottom panel color-coded by PD-1/PD-L1 expression. Red arrows indicate the C1 and C3 clusters expressing PD-L1. (F) Dot plots display the frequencies of T8 memory clusters in peripheral blood and tumor. The central bar represents the mean ± SEM. Statistical analysis was performed using a generalized linear mixed model (GLMM) test, with adjusted p-values reported in the figure as ∗p < 0.05, ∗∗p < 0.01, ∗∗∗p < 0.005, ∗∗∗∗p < 0.001. (G) UMAP plot as in e depicting the trajectory analysis (black arrow) of T8 memory cells color-coded by pseudotime value.
Figure 4
Figure 4
Single-cell spatial localization of lung infiltrating PD-L1+ CD8+ T cells (A) Two-dimensional UMAP representation of multiplexed proteomic data highlighted by cell phenotype (clusters; n = 15) and sample id (n = 2; total ROI = 6). Each dot represents one cell. (B) Heatmap of median values of normalized protein expression per cell cluster. Markers and clusters were arranged by hierarchical clustering with Ward’s method. (C) Representative multichannel IMC images (ROI: region of interest) from sample 2 (left) and sample 1 (right). Pan Keratin (Pan-K, green), CD3 (blue), CD8a (red), CD20 (cyan) and PD-L1 (yellow) were used to depict the structure of the tumor tissue along with the localization of TLS and PD-L1+ CD8+ T cells. Scale bars, 300 μm. (D) Heatmap depicting significant pairwise cell–cell interaction (red) or avoidance (blue) between all cell types of the dataset. (E) Violin plot showing the levels of manually selected exhaustion genes in PD-L1 vs. PD-L1+ CD8+ T cells from NSCLC (GSE99254, stage I-IV) and melanoma (GSE120575, stage III-IV) cohorts. (F) (left) UMAP depicting CD8+ T cell heterogeneity in the GSE154826 dataset (NSCLC patients, stage I-IIB). Cells are colored according to the six clusters defined in an unsupervised manner; (right) violin plot illustrating both mRNA and protein expression of manually selected markers indicative of T cell dysfunction.
Figure 5
Figure 5
Flow cytometry analysis reveals increased percentages of PD-L1+ CD8+ T cells in the bronchoalveolar lavage (BAL) of NSCLC individuals and in pleural fluid (PF) of individuals with thoracic malignancies (A and B) Representative FACS Dot plots showing gating of CD8+ PD-L1+ T cells in BALF from NSCLC individuals with bronchiectasis (n = 10) B) Box and whiskers plots of collective flow cytometry data of CD8+ PD-L1+ cells in BALF. (C and D) Representative FACS Dot plots showing gating of CD8+ PD-L1+ T cells in PF from individuals with thoracic malignancies (n = 6) and pleural infections (n = 4) bronchiectasis (n = 10 per group) D) Box and whiskers plots of collective flow cytometry data of CD8+ PD-L1+ cells in PF cells. Unpaired two tailed Mann-Whitney test ∗p < 0.05, ∗∗p < 0.01.
Figure 6
Figure 6
Transcriptional profiling of PD-L1+ CD8+ T cells (A) Heatmap of differentially expressed genes (FDR < 0.05) between FACS-sorted PD-L1 (n = 9) vs. PD-L1+ (n = 9) CD8+ T cells subsets from the blood of patients with NSCLC, as obtained by bulk RNA-seq. Selected differentially expressed genes are indicated. (B) Hallmark gene sets (MsigDB; as obtained by GSEA) significantly enriched in cells sorted as in a. (C) Transcription factor binding motif (TFBM) enrichment analysis by pScan of RNA-seq data obtained as in A. Only genes upregulated in PD-L1+ CD8+ T cells were used. Colored dots indicate significant hits. (D) Heatmap of differentially expressed genes (FDR < 0.05) between FACS-sorted PD-L1+ CD8+ T cells from responder (n = 5) and non-responder (n = 4) NSCLC patients receiving ICB therapy. Selected differentially expressed genes are indicated. (E) Kaplan–Meier overall survival (OS) curves in the immunotherapy dataset (KM plotter) of patients with NSCLC. The mean Z score value of reported genes was used to classify tumor samples into LOW and HIGH expression groups. P-values were calculated using the log rank (Mantel–Cox) test. Hazard ratio (HR) and log rank p-values are reported in the figures.

References

    1. Hiam-Galvez K.J., Allen B.M., Spitzer M.H. Systemic immunity in cancer. Nat. Rev. Cancer. 2021;21:345–359. doi: 10.1038/s41568-021-00347-z. - DOI - PMC - PubMed
    1. Garon E.B., Hellmann M.D., Rizvi N.A., Carcereny E., Leighl N.B., Ahn M.J., Eder J.P., Balmanoukian A.S., Aggarwal C., Horn L., et al. Five-Year Overall Survival for Patients With Advanced Non‒Small-Cell Lung Cancer Treated With Pembrolizumab: Results From the Phase I KEYNOTE-001 Study. J. Clin. Oncol. 2019;37:2518–2527. doi: 10.1200/JCO.19.00934. - DOI - PMC - PubMed
    1. Sharma P., Hu-Lieskovan S., Wargo J.A., Ribas A. Primary, Adaptive, and Acquired Resistance to Cancer Immunotherapy. Cell. 2017;168:707–723. doi: 10.1016/j.cell.2017.01.017. - DOI - PMC - PubMed
    1. Thai A.A., Solomon B.J., Sequist L.V., Gainor J.F., Heist R.S. Lung cancer. Lancet. 2021;398:535–554. doi: 10.1016/S0140-6736(21)00312-3. - DOI - PubMed
    1. Bai R., Chen N., Li L., Du N., Bai L., Lv Z., Tian H., Cui J. Mechanisms of Cancer Resistance to Immunotherapy. Front. Oncol. 2020;10:1290. doi: 10.3389/fonc.2020.01290. - DOI - PMC - PubMed

LinkOut - more resources