. 2025 Aug 11:16:1627134.
doi: 10.3389/fgene.2025.1627134. eCollection 2025.

Identification and experimental validation of prognostic genes related to cytochrome c in breast cancer

Affiliations

Identification and experimental validation of prognostic genes related to cytochrome c in breast cancer

Huimin Yu et al. Front Genet. .

Abstract

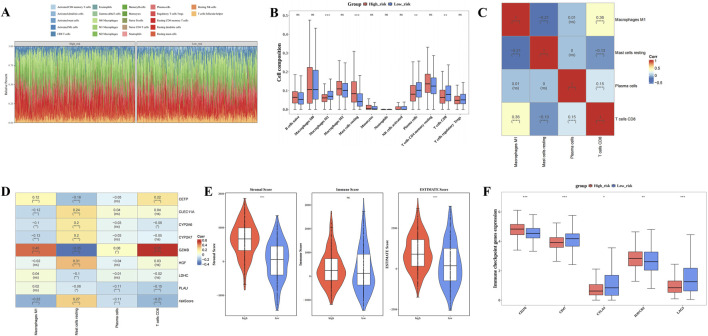
Breast cancer (BC) is one of the most prevalent malignant diseases affecting women. Cytochrome c (Cyt c) plays a critical role in various pathological processes, however, its precise mechanism in BC remains unclear. This study aimed to identify prognostic genes linked to Cyt c in BC and explore their underlying mechanisms. Transcriptome data related to BC were initially obtained from TCGA and GEO database. Prognostic genes were identified through differential expression analysis, univariate Cox regression, and LASSO analysis. A risk model was subsequently developed and validated. Additionally, enrichment analysis, immune microenvironment analysis, and the construction of a TFs-mRNA network were conducted. Finally, the expression levels of prognostic genes were examined in both tumor and normal tissue samples, with confirmation through RT-qPCR. Eight prognostic genes (CETP, CLEC11A, CYP2A6, CYP2A7, GZMB, HGF, LDHC, and PLAU) were identified. The risk model demonstrated that low-risk individuals have significantly higher survival rates. GSEA results indicated that seven of the prognostic genes are notably enriched in the "cytokine-cytokine receptor interaction" pathway. Transcription factors, such as ATF3 and RUNX1, were found to regulate these prognostic genes. Furthermore, immune cell profiles revealed significant differences between high-risk and low-risk groups. Bioinformatics and RT-qPCR analyses confirmed that CETP and HGF are upregulated in normal tissues, while CLEC11A and PLAU showed higher expression in BC tissues. This study identified eight Cyt c-related prognostic genes and developed a risk model, offering new insights into personalized treatment and prognosis for BC.

Keywords: breast cancer; cytochrome c; cytokine-cytokine receptor interaction; prognostic genes; risk model.


Conflict of interest statement

The authors declare that the research was conducted in the absence of any commercial or financial relationships that could be construed as a potential conflict of interest.

Figures

FIGURE 1
FIGURE 1
Candidate gene selection and enrichment analysis. (A) Volcano plots showed upregulated and downregulated genes in normal patients and Breast cancer (BC) patients in the The Cancer Genome Atlas - Breast Invasive Carcinoma (TCGA-BRCA) dataset. Horizontal coordinates indicate multiplicity of differences (tumor/normal, logarithmic), vertical coordinates indicate -log10(padj), each dot in the volcano plot represents a gene, and the color of the dots-blue indicates downregulation of gene expression, red indicates upregulation of gene expression. (B) Heat map showed upregulated and downregulated genes in normal patients and Breast cancer (BC) patients in the The Cancer Genome Atlas - Breast Invasive Carcinoma (TCGA-BRCA) dataset. The top heatmap from blue to red indicates the increase in the number of samples, the middle indicates the grouping of samples (Tumor group and Normal group); the bottom heatmap, each row indicates the expression profile of each gene in different samples, and each column indicates the expression profile of all DEGs in each sample. The dendrogram on the left side represents the results of cluster analysis of different genes from different samples. Each small square in the heatmap on the right side represents each gene, and its color represents the magnitude of gene expression, the darker the color indicates the higher expression of the gene (red is high expression, blue is low expression). (C) Venn diagram showed the screening of 171 candidate genes. Yellow indicates differential genes and green indicates cytochrome C-related genes. (D,E) Gene Ontology (GO) and Kyoto Encyclopedia of Genes and Genomes (KEGG) enrichment analysis. In the GO circle diagram, clockwise rotation is the horizontal coordinate, red, blue and yellow stand for BP, CC and MF, respectively, and the extension from the center to the circumference of the circle is the vertical coordinate, with a total of four levels, the first being the GO function, the second being the number of up- and downregulated genes, the third being the total number of enriched genes, and the fourth being the GO number. In the KEGG circle diagram, the clockwise rotation is the horizontal coordinate, the red color represents the KEGG pathway, and the extension from the center to the circumference of the circle is the vertical coordinate, which has four levels in total: the first level is the KEGG pathway, the second is the number of up- and downregulated genes, the third is the total number of enriched genes, and the fourth is the KEGG number.
FIGURE 2
FIGURE 2
Screening of prognostic genes and construction of risk models. (A) Forest plot of univariate Cox regression analysis for screening prognostic genes. (B,C) Construction of Least Absolute Shrinkage and Selection Operator (Lasso) model. (D,E) Risk curve and survival status distribution diagram (TCGA_BRCA dataset). (F–G) Kaplan-Meier (KM) survival curve and Receiver Operating Characteristic (ROC) curve (TCGA_BRCA dataset). (H,I) Risk curve and survival status distribution diagram (GSE20685 dataset). (J,K) KM survival curve and ROC curve (GSE20685 dataset).
FIGURE 3
FIGURE 3
Construction of nomogram model and comparison of risk scores among clinical subtypes. (A) Forest plot of clinical features in univariate cox regression analysis. (B) Forest plot of clinical features in multivariate cox regression analysis. (C) Analysis of the nomogram model. (D) Validation of the nomogram model: Receiver Operating Characteristic (ROC) curve. (E–J) Analysis of risk score differences by clinical characteristics (**** represents p < 0.0001, *** represents p < 0.001, ** represents p < 0.01, * represents p < 0.05, ns represents not significant).
FIGURE 4
FIGURE 4
Gene Set Variation Analysis (GSVA) and Gene Set Enrichment Analysis (GSEA) enrichment analysis of prognostic genes. (A) GSVA enrichment analysis. (B–I) GSEA enrichment analysis.
FIGURE 5
FIGURE 5
Different immune microenvironments within High risk group (HRG) and Low risk group (LRG). (A) Infiltration ratios of 22 distinct immune cell types within HRG and LRG. (B) Box plot of immune infiltrating cells based on the enrichment score between High/Low risk groups. (C) Correlation heat map between 4 types of immune cells. (D) Heat map of the correlation between 8 prognostic genes and 4 immune cells. (E) Differences in immune score, stromal score, and ESTIMATE score between low-risk and high-risk groups. (F) Box plot of differential expression of immune checkpoint genes between high-risk and low-risk groups. (**** represents p < 0.0001, *** represents p < 0.001, ** represents p < 0.01, * represents p < 0.05, ns represents not significant).
FIGURE 6
FIGURE 6
Different genetic mutations within High risk group (HRG) and Low risk group (LRG). (A,B) The top 20 genes with the highest mutation frequency between the high-risk group and the low-risk group. (C,D) The most common base substitution observed in Breast cancer (BC) samples was Cytosine (C) > Thymine (T). (E) Differences in tumor mutation burden (TMB) scores between high and low risk groups.
FIGURE 7
FIGURE 7
Different drug sensitivities within High risk group (HRG) and Low risk group (LRG) as well as Transcription Factors-messenger RNAs (TFs-mRNAs) network of prognostic genes. (A) Box plot of drug sensitivity prediction between high and low risk groups. (B–F) 5 drugs demonstrated a pronounced inverse association with risk score (P < 0.05, cor < −0.3). (G) Transcription Factors-messenger RNAs (TFs-mRNAs) network of prognostic genes.
FIGURE 8
FIGURE 8
The prognostic genes exhibited distinct content patterns in Breast cancer (BC) tumor tissues compared to normal tissues. (A,B) Expression of prognostic genes in BC group and control group (TCGA-BRCA and GSE42568 datasets). ns indicates p > 0.05, * indicates p < 0.05, ** indicates p < 0.01, ***indicates p < 0.001, **** indicates p < 0.0001. (C–F) Verification of prognostic genes by reverse transcription-quantitative polymerase chain reaction (RT-qPCR) experiments. * indicates p < 0.05, ** indicates p < 0.01.

References

    1. Abudushataer M., Sato N., Mieno M., Sawabe M., Muramatsu M., Arai T. (2020). Association of CYP2A6 gene deletion with cancers in Japanese elderly: an autopsy study. Bmc Cancer 20 (1), 186. 10.1186/s12885-020-6663-4 - DOI - PMC - PubMed
    1. Afzal M., Noreen R., Aslam N., Alam M. M., Momenah M. A. (2024). Novel noninvasive serum biomarkers for prompt diagnosis of breast carcinoma. ACS Omega 9 (1), 1174–1182. 10.1021/acsomega.3c07431 - DOI - PMC - PubMed
    1. Aguchem R. N., Okagu I. U., Okorigwe E. M., Uzoechina J. O., Nnemolisa S. C., Ezeorba T. P. C. (2024). Role of CETP, PCSK-9, and CYP7-alpha in cholesterol metabolism: potential targets for natural products in managing hypercholesterolemia. Life Sci. 351, 122823. 10.1016/j.lfs.2024.122823 - DOI - PubMed
    1. Autenshlyus A., Davletova K., Varaksin N., Marinkin I., Lyakhovich V. (2021). Cytokines in various molecular subtypes of breast cancer. Int. J. Immunopath P. H. 35, 20587384211034089. 10.1177/20587384211034089 - DOI - PMC - PubMed
    1. Bai Y., Xu H., Guo M., Xia L., Deng S. (2024). Extensive infiltration of CD8+ T cells and M1 macrophages is beneficial for multiple cancer patients undergoing chemotherapy. MedComm – Oncol. 3 (3), e89. 10.1002/mog2.89 - DOI

LinkOut - more resources