Published Erratum
. 2025 Aug 8:12:1578594.
doi: 10.3389/fcvm.2025.1578594. eCollection 2025.

Corrigendum: The cardiac dysfunction caused by metabolic alterations in Alzheimer's disease

Affiliations
Published Erratum

Corrigendum: The cardiac dysfunction caused by metabolic alterations in Alzheimer's disease

Jiayuan Murphy et al. Front Cardiovasc Med. .

Abstract

[This corrects the article DOI: 10.3389/fcvm.2022.850538.].

Keywords: Alzheimer's Disease; cardiac dysfunction; glucose metabolic alterations; metabolic regulation; mitochondrial deficits.


Figures

Figure 1
Figure 1
Cardiac systolic dysfunction in 5XFAD compared to WT mice chronologically. (A) Echocardiography showed that 5XFAD mice developed progressive cardiac systolic dysfunction over time with reduced left ventricular function as shown by ejection fraction (EF) and fractional shortening (FS). Upper: Representative images of M-mode echocardiography. Lower: Quantification of echocardiography measurements for EF and FS. Biological replicates N = 9 for each group. P-value was determined by two-way ANOVA with Tukey's post hoc test. (B) Electrocardiography (ECG) showed that 5XFAD mice developed a decreased electrical signal over time with a reduced P wave, QRT complex, and the T wave. Upper: Representative images of ECG parameters. Lower: Quantification of ECG measurements. Biological replicates N = 8 for each group. P-value was determined by two-way ANOVA with Tukey's post hoc test.
Figure 3
Figure 3
Impairs mitochondrial oxidative phosphorylation in the 5XFAD heart, hippocampus, and cortex. (A) Mitochondrial stress assay examined the mitochondrial oxidative phosphorylation (OXPHOS) complexes activity in the heart of 5XFAD (6 months) and WT (6 months) mice demonstrated by measuring the oxygen consumption rate (OCR). N = 6 for each group. For each mouse, we collected 9–10 wells using isolated cardiomyocytes for OCR measurement and averaged the results to obtain a single value per mouse. P-value determined by two-tailed students t-test. (B) Mitochondrial stress assay examined the mitochondrial oxidative phosphorylation (OXPHOS) complexes activity in the hippocampus of 5XFAD (6 months) and WT (6 months) mice demonstrated by measuring the oxygen consumption rate (OCR). N = 6 for each group. For each mouse, we collected 1–2 tissue samples for OCR measurement and averaged the results to obtain a single value per mouse. P-value determined by two-tailed students t-test. (C) Mitochondrial stress assay examined the mitochondrial oxidative phosphorylation (OXPHOS) complexes activity in the cortex of 5XFAD (6 months) and WT (6 months) mice demonstrated by measuring the oxygen consumption rate (OCR). N = 6 for each group. For each mouse, we collected 1–2 tissue samples for OCR measurement and averaged the results to obtain a single value per mouse. P-value determined by two-tailed students t-test.
Figure 4
Figure 4
Excessive oxidative stress and provoked cellular proinflammatory signaling in 5XFAD heart and brain. (A) MitoSox staining showed increased superoxide accumulation in the heart of 5XFAD (6 months) mice vs. WT (6 months) mice. Biological replicates N = 3 for each group. For each mouse, we collected 3–4 tissue sections for superoxide accumulation measurement and averaged the results to obtain a single value per mouse. P-value determined by two-tailed students t-test. (B) MitoSox staining showed increased superoxide accumulation in the hippocampus and cortex of 5XFAD (6 months) mice vs. WT (6 months) mice. Biological replicates N = 3 for each group. For each mouse, we collected 3–4 tissue sections for superoxide accumulation measurement and averaged the results to obtain a single value per mouse. P-value determined by two-tailed students t-test.
Figure 5
Figure 5
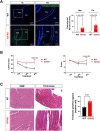
Aβ burden and cognitive function assessment in AD mice. (A) Representative images and quantification of Aβ stained with 6E10 antibody in the hippocampus and cortex of 5XFAD (6 months) mice and WT (6 months) mice. Biological replicates N = 8 for each group. P-value determined by two-tailed students t-test. (B) Radial arm water maze test showed the latencies to hidden platform and the errors happen in arms in WT (6 months) and 5XFAD (6 months) mice. Biological replicates N = 8 for each group. P-value determined by two-tailed students t-test. (C) Myocardial histology analysis showed elevated fibrosis in 5XFAD (6 months) mice heart compared to the WT (6 months) group. Biological replicates N = 3 for each group. For each mouse, we collected 4 tissue sections for measurement and averaged the results to obtain a single value per mouse. P-value determined by two-tailed students t-test. Black arrows highlighted the inflammatory infiltration and fibrosis formation in 5XFAD (6 months) heart H&E staining and Trichrome staining, respectively.

Erratum for

Publication types

LinkOut - more resources