Spatio-temporal characteristics of the gastrointestinal resistome in a cow-to-calf model and its environmental dissemination in a dairy production system
- PMID: 40860434
- PMCID: PMC12371271
- DOI: 10.1002/imt2.70047
Spatio-temporal characteristics of the gastrointestinal resistome in a cow-to-calf model and its environmental dissemination in a dairy production system
Abstract
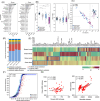
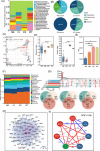
Microbiome and resistome transmission from mother to child, as well as from animal to environment, has been widely discussed in recent years. Dairy cows mainly provide milk and meat. However, in the dairy production system, the characteristics and transmission trends of resistome assembly and the microbiome in the gastrointestinal tract (GIT) remain unclear. In this study, we sequenced the GIT (rumen fluid and feces) microbiome of dairy cow populations from two provinces in China (136 cows and 36 calves), determined the characteristics of their resistome profiles and the distribution of antibiotics resistance genes (ARGs) across bacteria and further tracked the temporal dynamics of the resistome in offspring during early life using multi-omics technologies (16S ribosomal RNA [rRNA] sequencing, metagenome, and metatranscriptome). We characterized the GIT resistome in cows, distinguished by gut sites and regions. The abundance of ARGs in calves peaked within the first 3 days after birth, with Enterobacteriaceae as the dominant microbial host. As calves aged, resistome composition stabilized, and overall ARG abundance gradually decreased. Both diet and age influenced carbohydrate-active enzymes and ARG profiles. Resistance profiles in ecological niches (meconium, colostrum, soil, and wastewater) were unique, resembling maternal sources. Mobile genetic elements (MGEs), mainly found in soil and wastewater, played an important role in mediating these interactions. Multidrug resistance consistently emerged as the most significant form of resistance at the both the metagenome and metatranscriptome levels. Several antibiotic classes showed higher proportions at the RNA level than at the DNA level, indicating that even low-abundance gene groups can have a considerable influence through high expression. This study broadens our understanding of ARG dissemination in livestock production systems, providing a foundation for developing future preventive and control strategies.
Keywords: antimicrobial resistance genes; dairy production system; gastrointestinal tract; microbiome transmission; multi‐omics analysis.
© 2025 The Author(s). iMeta published by John Wiley & Sons Australia, Ltd on behalf of iMeta Science.
Conflict of interest statement
The authors declare no conflict of interest.
Figures


Similar articles
-
Prescription of Controlled Substances: Benefits and Risks.2025 Jul 6. In: StatPearls [Internet]. Treasure Island (FL): StatPearls Publishing; 2025 Jan–. 2025 Jul 6. In: StatPearls [Internet]. Treasure Island (FL): StatPearls Publishing; 2025 Jan–. PMID: 30726003 Free Books & Documents.
-
Subclinical disease elevates zoonotic risks of antibiotic resistance and virulence factor genes through gut microbial network in dairy cow production system.J Hazard Mater. 2025 Sep 15;496:139218. doi: 10.1016/j.jhazmat.2025.139218. Epub 2025 Jul 12. J Hazard Mater. 2025. PMID: 40779856
-
Hi-C untangles the temporal dynamics of the children's gut resistome and mobilome, highlighting the role of transposable elements.mBio. 2025 Sep 10;16(9):e0113425. doi: 10.1128/mbio.01134-25. Epub 2025 Aug 12. mBio. 2025. PMID: 40793781 Free PMC article.
-
Systemic pharmacological treatments for chronic plaque psoriasis: a network meta-analysis.Cochrane Database Syst Rev. 2021 Apr 19;4(4):CD011535. doi: 10.1002/14651858.CD011535.pub4. Cochrane Database Syst Rev. 2021. Update in: Cochrane Database Syst Rev. 2022 May 23;5:CD011535. doi: 10.1002/14651858.CD011535.pub5. PMID: 33871055 Free PMC article. Updated.
-
Systemic pharmacological treatments for chronic plaque psoriasis: a network meta-analysis.Cochrane Database Syst Rev. 2020 Jan 9;1(1):CD011535. doi: 10.1002/14651858.CD011535.pub3. Cochrane Database Syst Rev. 2020. Update in: Cochrane Database Syst Rev. 2021 Apr 19;4:CD011535. doi: 10.1002/14651858.CD011535.pub4. PMID: 31917873 Free PMC article. Updated.
References
-
- Inda‐Díaz, Juan Salvador , Lund David, Parras‐Moltó Marcos, Johnning Anna, Bengtsson‐Palme Johan, and Kristiansson Erik. 2023. “Latent Antibiotic Resistance Genes Are Abundant, Diverse, and Mobile in Human, Animal, and Environmental Microbiomes.” Microbiome 11: 44. 10.1186/s40168-023-01479-0 - DOI - PMC - PubMed
-
- Wang, Yangyang , Li Yingwei, Li Hu, Zhou Jian, and Wang Tiecheng. 2023. “Seasonal Dissemination of Antibiotic Resistome From Livestock Farms to Surrounding Soil and Air: Bacterial Hosts and Risks for Human Exposure.” Journal of Environmental Management 325: 116638. 10.1016/j.jenvman.2022.116638 - DOI - PubMed
-
- Wu, Shengru , Wang Jian, Zhu Liqin, Ren Hao, and Yang Xiaojun. 2020. “A Novel Apidaecin Api‐PR19 Synergizes With the Gut Microbial Community to Maintain Intestinal Health and Promote Growth Performance of Broilers.” Journal of Animal Science and Biotechnology 11: 61. 10.1186/s40104-020-00462-1 - DOI - PMC - PubMed
-
- Ding, Dong , Zhu Jingyuan, Gao Yanling, Yang Fan, Ma Yan, Cheng Xuemin, Li Jinlei, et al. 2022. “Effect of Cattle Farm Exposure on Oropharyngeal and Gut Microbial Communities and Antibiotic Resistance Genes in Workers.” Science of the Total Environment 806: 150685. 10.1016/j.scitotenv.2021.150685 - DOI - PubMed
LinkOut - more resources
Full Text Sources
Research Materials
