. 2025 May 19;4(4):e70048.
doi: 10.1002/imt2.70048. eCollection 2025 Aug.

Gut microbiota-derived butyric acid regulates calcific aortic valve disease pathogenesis by modulating GAPDH lactylation and butyrylation

Affiliations

Gut microbiota-derived butyric acid regulates calcific aortic valve disease pathogenesis by modulating GAPDH lactylation and butyrylation

Chunli Wang et al. Imeta. .

Abstract

The involvement of gut microbiota in calcific aortic valve disease (CAVD) pathogenesis remains underexplored. Here, we provide evidence for a strong association between the gut microbiota and CAVD development. ApoE-/- mice were stratified into easy- and difficult- to calcify groups using neural network and cluster analyses, and subsequent faecal transplantation and dirty cage sharing experiments demonstrated that the microbiota from difficult-to-calcify mice significantly ameliorated CAVD. 16S rRNA sequencing revealed that reduced abundance of Faecalibacterium prausnitzii (F. prausnitzii) was significantly associated with increased calcification severity. Association analysis identified F. prausnitzii-derived butyric acid as a key anti-calcific metabolite. These findings were validated in a clinical cohort (25 CAVD patients vs. 25 controls), where serum butyric acid levels inversely correlated with disease severity. Functional experiments showed that butyric acid effectively hindered osteogenic differentiation in human aortic valve interstitial cells (hVICs) and attenuated CAVD progression in mice. Isotope labeling and 13C flux analyses confirmed that butyric acid produced in the intestine can reach heart tissue, where it reshapes glycolysis by specifically modifying GAPDH. Mechanistically, butyric acid-induced butyrylation (Kbu) at lysine 263 of GAPDH competitively inhibited lactylation (Kla) at the same site, thereby counteracting glycolysis-driven calcification. These findings uncover a novel mechanism through which F. prausnitzii and its metabolite butyric acid contribute to the preservation of valve function in CAVD, highlighting the gut microbiota-metabolite-glycolysis axis as a promising therapeutic target.

Keywords: butyric acid; butyrylation; calcific aortic valve calcification; glycolysis; lactylation.


Conflict of interest statement

The authors declare no conflicts of interest.

Figures
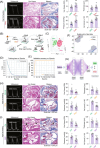
FIGURE 1
FIGURE 1
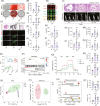
Aortic valve calcification is closely related to the gut microbiota. (A) Comparison of the degree of heart valve calcification in the difficult calcification and easy calcification groups of ApoE−/− mice after a high‐fat diet. (B) Flowchart of the dirty cage experiment and faecal microbiota transplantation. (C) The principal component analysis (PCA) and orthogonal partial least squares discriminant analysis (OPLS‐DA) cluster analysis were used to group high‐fat diet‐fed mice (difficult calcification and easy calcification mice) on the basis of Von Kossa staining (IOD) of mouse aortic valves, valve thickness, flow velocity (mm/s) and transvalvular pressure difference (mmHg). (D–G) Neural network analysis was used to validate the results of PCA and OPLS‐DA cluster analyses. (H) Squirrel cages from the difficult calcification group (B group in Figure B) were utilized to feed other high‐fat‐fed ApoE−/− mice (Dirty group). ApoE−/− mice fed in clean cages were used as the control group (Normal group). (I) Faecal microbiota transplantation (FMT) was performed on other high‐fat‐fed ApoE−/− mice (C group in Figure B), the faeces collected from the difficult calcification group (A1 group in Figure B). The non‐FMT mice were used as the control group. One‐way analysis of variance (ANOVA) was employed for multiple comparisons, whereas t tests were used for two‐group comparisons. *p < 0.05, **p < 0.01, ***p < 0.001 indicate significant differences compared with the control group, n = 12. Scale bar: 200 μm.
FIGURE 2
FIGURE 2
Gut microbial sequencing identified Faecalibacterium prausnitzii (F. prausnitzii) as the key species in faeces that inhibits valve calcification. (A) Community structure analysis with statistical results of the number of species annotated to the phylum order family species level in each sample, in which the microbial species in the faeces of easy calcification (Easy) mice were significantly lower than those of difficult calcification (Diffct) mice. (B) Rank abundance (Abd) analysis showing differences in the abundance and homogeneity of the species contained in faeces samples of difficult calcification versus easy calcification mice. (C and D) Sample alpha diversity analysis. (E) Distance matrix after beta diversity analysis. (F) Taxonomic analysis via PCA. (G) Taxonomic analysis via NMDS. (H) Hierarchical clustering tree between samples. (I) Top 10 heatmaps of differential species abundance, Burkholderiales_bacterium (Burk bact) and Faecalibacterium prausnitzii (F. prausnitzii) detectable in the whole samples. (J) Multimetric correlation analysis between Burk bact strain abundance and valve calcification. (K) F. prausnitzii strain abundance and valve calcification multicriteria correlation analysis. (L) F. prausnitzii monoculture transplantation of ApoE−/− mice and high‐fat valve calcification modeling to assess the inhibitory effect of monoculture transplantation on valve calcification. (M) Human valve tissue ex vivo samples under osteogenic medium (OM) induction were treated with the medium supernatant of F. prausnitzii (FPM), and the degree of calcification was evaluated by Von Kossa staining, scale bar: 500 μm. (N) FPM was used to treat human aortic valve interstitial cells (hVICs) cells under OM induction, and alizarin red staining was used to evaluate the degree of calcification, scale bar: 100 μm. (O) FPM was used to treat hVICs cells under OM induction, and in‐cell WB was used to evaluate the expression of BMP2 and Runx2 calcification markers in hVICs cells. One‐way ANOVA was employed for multiple comparisons, whereas t tests were used for two‐group comparisons. *p < 0.05; **p < 0.01; ***p < 0.001 indicate significant differences, n = 12.
FIGURE 3
FIGURE 3
Metabolomic analysis of faeces and serum identified butyric acid as a key mediator of anticalcification in F. prausnitzii. (A–D) Cluster analysis of the metabolites PCA and OPLS‐DA in the faeces and serum of easy‐calcification and difficult‐calcification ApoE−/− mice (n = 24, 12 vs. 12). (E, F) Compositional analysis of the metabolites in the faeces (n = 24) and serum (n = 24). (G) 107 common differentially abundant metabolites were identified between the serum and faeces, of which 75 common differentially abundant metabolites were detected in all the samples. (H, I) Differences in the abundance of butyric acid in the faeces and serum of the mice. (J, K) Correlation analysis of the faecal and serum abundance of butyric acid with the abundance of F. prausnitzii. (L–N) Determination of butyric acid in the faeces, serum and heart of the easy calcification and difficult calcification ApoE−/− mice. (O) Determination of butyric acid in the serum of healthy and CAVD patients (n = 50). (P–R) Total ion flow and MS identification of the 13C‐labeled butyric acid detected in the faeces, serum and heart of the mice after oral gavage (BA: 13C‐labeled butyric acid oral administration group; HF: fed a high‐fat diet; control: nontreatment). (S–U) Abundance of isotope 13C‐labeled butyric acid detected in faeces, serum and heart. (V) Relative abundance of isotope 13C‐labeled butyric acid in the heart was assayed within 24 h of gavage. One‐way ANOVA was employed for multiple comparisons, whereas t tests were used for two‐group comparisons. ***p < 0.001, significant difference compared with the control group.
FIGURE 4
FIGURE 4
Butyric acid inhibited heart valve calcification through regulating glycolytic metabolism in hVICs. (A, B) Effects of butyric acid on calcium deposition in osteogenic medium (OM)‐induced calcific hVICs detected by alizarin red staining, scale bar: 100 μm. (C–F) Evaluation of calcification level in butyric acid‐treated human valve tissues ex vivo, including Von Kossa staining, and immunofluorescence staining of Runx2 and BMP2, scale bar: 500 μm, n = 5. (G–I) In‐cell western blot analysis of Runx2 and BMP2 in butyric acid‐treated hVICs under OM‐induced calcification, n = 3. (J–N) Evaluation of calcification level in butyric acid‐treated ApoE−/− mice after high‐fat‐feeding‐induced heart valve calcification, scale bar: 200 μm, n = 5. (O) PCA clustering analysis of butyric acid‐treated hVICs under OM‐induced calcification utilizing RNA‐seq, n = 3. (P) GSEA indicated that glycolysis metabolism was significantly different in hVICs under OM‐induced calcification between butyric acid‐treated and nonbutyric acid‐treated groups. (Q, R) Extracellular acidification rates (ECAR) and glycolysis levels in hVICs of the control, OM and OM + BA groups, n = 3. (S, T) PCA and OPLS‐DA clusting analysis based on cellular metabolomics detection in hVICs of the control, OM and BA + BA groups. (U) KEGG analysis on different metabolites in hVICs of the control, OM and OM + BA groups. (V) Abundance of glucose and lactate in butyric acid‐treated hVICs under OM‐induced calcification. One‐way ANOVA was employed for multiple comparisons, whereas t tests were used for two‐group comparisons. *p < 0.05, **p < 0.01, ***p < 0.001 indicate significant differences compared with the control group; # p < 0.05, ## p < 0.01, ### p < 0.001 indicate significant differences compared with the OM or HF group.
FIGURE 5
FIGURE 5
Butyric acid exerts antivalvular calcification effects by competitively inhibiting GAPDH lactylation. (A) In‐cell WB assay of global intracellular lactylation levels after treatment of osteogenic medium (OM)‐induced hVICs with butyric acid, n = 3. (B) The lactylation of GAPDH was most significantly inhibited by butyric acid, n = 3. (C) Sequencing analysis of lactylation levels of the glycolytic enzymes by butyric acid under OM induction, n = 3. (D, E) Histological analysis of hVICs subjected to OM induction revealed three significant lactylation sites in GAPDH. (F) Homology analysis of the three lactylated sites in different species. (G) Sequencing analysis of mutant plasmids of the three lactylated sites. (H) Alizarin red staining was used to analyze the role of three lactylated site mutations in regulating valve calcification, n = 5. Analysis of the role of three lactylated site mutations in regulating valve calcification via western blot analysis, n = 3 (I), in‐cell WB (J) and immunofluorescence staining (K) for Runx2 and BMP2 protein expression, scale bar: 200 μm, n = 5. (L) Immunoprecipitation analysis of butyric acid treatment affecting the butyrylation and lactylation level of GAPDH, n = 3. (M) Changes in the expression of GAPDH K263Bu/K263Lac and the calcification marker Runx2/BMP2 after butyric acid treatment. (N) Expression analysis of K263 butyrylation and lactylation with the calcification marker Runx2/BMP2 in hVICs collected from eight calcified patients versus eight healthy patients. (O) Correlation analysis of K263 butyrylation and K263 lactylation co‐expression with the calcification marker Runx2/BMP2, respectively. One‐way ANOVA was employed for multiple comparisons, whereas t tests were used for two‐group comparisons. *p < 0.05, **p < 0.01, ***p < 0.001 indicate significant differences compared with the control group.

References

    1. Small, Aeron M. , Yutzey Katherine E., Binstadt Bryce A., Voigts Key Kaitlin, Bouatia‐Naji Nabila, Milan David, Aikawa Elena, Otto Catherine M., and St. Hilaire Cynthia. 2024. “Unraveling the Mechanisms of Valvular Heart Disease to Identify Medical Therapy Targets: A Scientific Statement From the American Heart Association.” Circulation 150: e109–e128. 10.1161/CIR.0000000000001254 - DOI - PMC - PubMed
    1. Moncla, Louis‐Hippolyte Minvielle , Briend Mewen, Bossé Yohan, and Mathieu Patrick. 2023. “Calcific Aortic Valve Disease: Mechanisms, Prevention and Treatment.” Nature Reviews Cardiology 20: 546–559. 10.1038/s41569-023-00845-7 - DOI - PubMed
    1. Rutkovskiy, Arkady , Malashicheva Anna, Sullivan Gareth, Bogdanova Maria, Kostareva Anna, Stensløkken Kåre‐Olav, Fiane Arnt, and Vaage Jarle. 2017. “Valve Interstitial Cells: The Key to Understanding the Pathophysiology of Heart Valve Calcification.” Journal of the American Heart Association 6: e006339. 10.1161/jaha.117.006339 - DOI - PMC - PubMed
    1. Huang, Yuming , Jiang Chen, Chen Liang, Han Juanjuan, Liu Ming, Zhou Tingwen, Dong Nianguo, and Xu Kang. 2023. “ Gli1 Promotes the Phenotypic Transformation of Valve Interstitial Cells Through Hedgehog Pathway Activation Exacerbating Calcific Aortic Valve Disease.” International Journal of Biological Sciences 19: 2053–2066. 10.7150/ijbs.74123 - DOI - PMC - PubMed
    1. Wang, Chunli , Huang Yuming, Liu Xianqiong, Li Lanqing, Xu Haiying, Dong Nianguo, and Xu Kang. 2021. “Andrographolide Ameliorates Aortic Valve Calcification by Regulation of Lipid Biosynthesis and Glycerolipid Metabolism Targeting MGLL Expression In vitro and In vivo .” Cell Calcium 100: 102495. 10.1016/j.ceca.2021.102495 - DOI - PubMed

LinkOut - more resources