. 2025 Aug 11:12:1595390.
doi: 10.3389/fnut.2025.1595390. eCollection 2025.

Global, regional, and national burdens of eating disorders from 1990 to 2021 and projection to 2035

Affiliations

Global, regional, and national burdens of eating disorders from 1990 to 2021 and projection to 2035

Xiangrong Liu et al. Front Nutr. .

Abstract

Background: Eating disorders severely impact the physical and mental health and challenge global healthcare. This study examined global trends in incidence, mortality, and disability-adjusted life years (DALYs) related to eating disorders from 1990 to 2021 and projected the burden to 2035.

Methods: Data from Global Burden of Disease (GBD) 2021 were used to calculate mortality, incidence, and DALYs rates. Analyses were stratified by age, sex, disorder type, and region. Frontier analysis quantified the gap between current and minimum achievable burdens. Decomposition analysis assessed population growth, aging, and epidemiological transitions. Health inequalities were studied using inequality indices. Future trends were predicted using Bayesian Age-Period-Cohort (BAPC) modeling.

Results: The age-standardized DALYs rate for eating disorders increased from 37.33 (95% UI: 22.67-58.60) to 43.36 per 100,000 (95% UI: 26.35-68.45), and the age-standardized incidence rate (ASIR) rose from 106.78 (95% UI: 74.30-150.89) to 124.4 per 100,000 (95% UI: 86.48-175.74). The age-standardized DALYs rate (EAPC = 0.67) and ASIR (EAPC = 0.55) increased at faster annual rates for bulimia nervosa than for anorexia nervosa. In 2021, the highest age-standardized death rate (ASDR) were recorded in Central Europe, the largest age-standardized DALYs rate were documented in Western Europe, and the greatest ASIR were reported in Andean Latin America. High sociodemographic index (SDI) regions bore the greatest burden. We also found that Females, particularly aged 15-24, experienced higher burdens. Decomposition analysis underscored the variations in the drivers of disease burden across different SDI regions. Analysis of health inequality showed that the disparity in disease burden attributable to economic factors has further widened. BAPC modeling predicted continued burden growth.

Conclusion: The disease burden imposed by eating disorders is gradually increasing, especially impacting women, youth, and young adults, and more so in regions with a high SDI index. Projections indicate that by 2035, this burden will still be substantial. Health inequalities due to the wealth gap have become more severe. These findings can guide targeted strategies for prevention and control.

Plain english summary: This is the first study to use the GBD 2021 data to provide a comprehensive in-depth study of the global, regional, and national burdens of eating disorders between 1990 and 2021. In this study, we explored the deeper drivers of the disease burden using frontier, decomposition, and health inequality analyses, in addition to describing the burden of mortality, morbidity, and DALYs in eating disorders. Potential trends through 2035 were also projected using BAPC modeling. We found that the disease burden imposed by eating disorders was gradually increasing. Health inequalities due to the wealth gap had become more severe. This study offered the most current and comprehensive global assessment of the burden of eating disorders, providing critical and updated evidence for healthcare professionals, public health practitioners, and policymakers worldwide. Emphasizing the holistic treatment of mental and physical health, and fostering global collaboration and data sharing were critical for advancing the study and prevention of eating disorders.

Keywords: anorexia nervosa; bulimia nervosa; disability-adjusted life years; eating disorder; global burden of disease; incidence; mortality.


Conflict of interest statement

The authors declare that the research was conducted in the absence of any commercial or financial relationships that could be construed as a potential conflict of interest.

Figures

Side-by-side line graphs labeled A and B compare age-standardized rates per 100,000 population across different Socio-Demographic Index (SDI) levels for 1990 and 2021. Graph A shows Disability-Adjusted Life Years (DALYs) rates, indicating a decline from high to low SDI. Graph B displays Age-Standardized Incidence Rates (ASIR), also showing a decrease across SDI categories. Both graphs use triangular markers for 1990 and diamond markers for 2021, with dashed lines connecting the points.
FIGURE 1
Age-standardized DALYs rate (A) and ASIR (B) of eating disorders in 5 SDI regions in 1990–2021. DALYs, disability-adjusted life years; ASIR, age-standardized incidence rate; SDI, socio-demographic index.
Graph A shows the age-standardized DALYs rate per 100,000 population in 1990 and 2021 across various regions, with fluctuations, peaking in Eastern Europe. Graph B displays ASIR for the same years and regions, also peaking in Eastern Europe, with generally higher rates than DALYs. Blue lines represent 1990 rates, and orange lines represent 2021 rates.
FIGURE 2
Age-standardized DALYs rate (A) and ASIR (B) of eating disorders in 21 Geographic Regions regions in 1990–2021. DALYs, disability-adjusted life years; ASIR, age-standardized incidence rate; SSA, Sub-Saharan Africa; LA, Latin America; AP, Asia Pacific; NA, North America; NAF, North Africa; ME, Middle East.
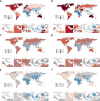
Global maps labeled A to F display color-coded data visualizations showing various regions, including the Caribbean, Persian Gulf, and Southeast Asia. Each map highlights areas in red, blue, and shades in between, with accompanying regional insets for detailed views. Color scales indicate quantitative values, likely related to a specific demographic or environmental data. These visualizations present a comparative analysis across different world regions.
FIGURE 3
The age-standardized DALYs rate and the ASIR of eating disorders (A,B), anorexia nervosa (C,D) and bulimia nervosa (E,F) across 204 countries and territories in 2021. DALYs, disability-adjusted life years; ASIR, age-standardized incidence rate.
Two sets of line charts labeled A and B show data from 1990 to 2019. Set A depicts DALYs for different regions, while set B illustrates incidence rates. Both sets include global and region-specific trends: high, high-middle, middle, low-middle, and low SDI. Each region’s chart demonstrates a gradual increase over time, with steeper inclines in lower SDI categories.
FIGURE 4
The trend of age-standardized DALYs rate (A) and ASIR (B) for eating disorders from 1990 to 2021. DALYs, disability-adjusted life years; ASIR, age-standardized incidence rate; SDI, socio-demographic index.
Four panel charts showing age-related epidemiological data for respiratory syncytial virus (RSV): A. Bar chart displaying death numbers by age group, with pink bars for females and RSV A, blue bars for males and RSV A, pink shaded areas for females and RSV A/B, and blue shaded areas for males and RSV A/B. B. Bar chart of Disability-Adjusted Life Years (DALYs) by age group, using the same color scheme as panel A. C. Incidence numbers with peaks for younger age groups, same color scheme as panel A. D. Similar to panel C but with adjusted incidence rates, using the same color scheme. Nine-panel chart illustrating various correlations with R-values and significance levels. Panels A, D, and G display line graphs depicting trends with multiple series. Panels B, E, and H present scatter plots with trend lines and data points labeled with names. Panels C, F, and I show scatter plots with trend lines and shaded confidence intervals. Each panel is marked with a correlation coefficient R and a P-value, indicating statistical significance.
FIGURE 5
The ASDR (A), age-standardized DALYs rate (B) and ASIR (C) per 100,000 people of eating disorders by age and sex in 2021. The ASIR (D) per 100,000 people of anorexia nervosa by age and sex in 2021. ASDR, age-standardized death rate; DALYs, disability-adjusted life years; ASIR, age-standardized incidence rate.
Nine-panel chart illustrating various correlations with R-values and significance levels. Panels A, D, and G display line graphs depicting trends with multiple series. Panels B, E, and H present scatter plots with trend lines and data points labeled with names. Panels C, F, and I show scatter plots with trend lines and shaded confidence intervals. Each panel is marked with a correlation coefficient R and a P-value, indicating statistical significance.
FIGURE 6
Association between ASR indicators of eating disorders and SDI. Eating disorders ASDR (A–C), age-standardized DALYs rate (D–F), ASIR (G–I). ASR, age-standardized rate; SDI, socio-demographic index; EAPC, estimated annual percentage change. ASDR, age-standardized death rate; DALYs, disability-adjusted life years; ASIR, age-standardized incidence rate.
Six-panel figure showing graphs of DALYs and incidence rates per 100,000 against SDI from 1990 to 2019, labeled A to F. Panels display trends with color-coded lines by year and trend indicators.
FIGURE 7
Frontier analysis exploring the relationship between SDI and ASR for eating disorders, anorexia nervosa and bulimia nervosa in 204 countries and territories. Age-standardized DALYs rate (A) and ASIR (B) of eating disorders, age-standardized DALYs rate (C) and ASIR (D) of anorexia nervosa, age-standardized DALYs rate (E) and ASIR (F) of bulimia nervosa. SDI, socio-demographic index; ASR, age-standardized rate; DALYs, disability-adjusted life years; ASIR, age-standardized incidence rate.
Six horizontal bar charts labeled A to F illustrate the contributions of aging, epidemiological change, and population to Disability-Adjusted Life Years (DALYs) and incidence across different Socio-demographic Index (SDI) levels: Global, High SDI, High-middle SDI, Middle SDI, Low-middle SDI, and Low SDI. Each chart displays a mix of red, blue, and green bars with overlapping sections. Black dots indicate specific data points. Charts A, C, and E focus on DALYs, while B, D, and F focus on incidence. The data reflects how these factors vary with development levels.
FIGURE 8
Decomposition analysis of the trends in eating disorders DALYs (A) and incidence (B), anorexia nervosa DALYs (C) and incidence (D) and bulimia nervosa DALYs (E) and incidence (F) from 1990 to 2021. DALYs, disability-adjusted life years.
Six graphs show data related to smoking prevalence by socioeconomic index (SDQ) for 1990 and 2021, with variations in region populations. Graphs A, C, and E display scatter plots of smoking prevalence against relative SDQ rank, while graphs B, D, and F show cumulative fraction plots. Different-sized circles indicate population differences, with lines representing trends over the years. The graphs highlight inequalities in smoking prevalence tied to socioeconomic status.
FIGURE 9
Health inequality regression curves and concentration curves for the age-standardized DALYs rate of eating disorder (A,B), anorexia nervosa (C,D), and bulimia nervosa (E,F), 1990 and 2021. DALYs, disability-adjusted life years.
A series of graphs depicting trends over time. Panel A shows a line graph with a declining trend and projections, with blue confidence intervals. Panel B contains multiple line graphs for different age groups (10-49 years), showing varying trends. Panel C shows an increasing trend with future projections, and Panel D contains age-group-specific graphs with rising trends. Panel E displays an increasing trend similar to Panel C, while Panel F shows multiple graphs for age groups (5-49 years) with rising projections. Each graph includes original data and future projections represented with different colors.
FIGURE 10
Projections of eating disorders ASDR (A,B), age-standardized DALYs rate (C,D) and ASIR (E,F) by 2035 based on the BAPC model. ASDR, age-standardized death rate; DALYs, disability-adjusted life years; ASIR, age-standardized incidence rate; BAPC, Bayesian Age-Period-Cohort.

Similar articles

References

    1. Makowski C, Shafiei G, Martinho M, Hagler D, Jr., Pecheva D, Dale A, et al. Multivariate patterns linking brain microstructure to temperament and behavior in adolescent eating disorders. medRxiv [Preprint]. (2024). 10.1101/2024.11.24.24317857 medRxiv: 2024.11.24.24317857. - DOI - PMC - PubMed
    1. Treasure J, Duarte T, Schmidt U. Eating disorders. Lancet. (2020) 395:899–911. 10.1016/S0140-673630059-3 - DOI - PubMed
    1. Natoli A, Allen L, Ashton C, Lamba N, Marek R. Measuring eating behavior and motivations in the United Arab Emirates and the United States: Evaluating measurement and predictive invariance of the eating disorder examination questionnaire-short form and the eating motivation survey. Psychol Assess. (2024) 37:62–9. 10.1037/pas0001352 - DOI - PubMed
    1. Cooper Z, Smith B, Kehle-Forbes S, Dorset J, Mitchell K. Eating disorders, co-morbid disorders and early risk factors amongst post-9/11 veteran men and women. J Clin Psychol. (2024) 81:133–44. 10.1002/jclp.23756 - DOI - PMC - PubMed
    1. Sangvai D. Eating disorders in the primary care setting. Prim Care. (2016) 43:301–12. 10.1016/j.pop.2016.01.007 - DOI - PubMed

LinkOut - more resources