Case Reports
. 2025 Aug 18;30(4):485.
doi: 10.3892/ol.2025.15231. eCollection 2025 Oct.

Thoracic paravertebral osteosarcoma induced by radiotherapy for esophageal cancer: A case report

Affiliations
Case Reports

Thoracic paravertebral osteosarcoma induced by radiotherapy for esophageal cancer: A case report

Bin Chen et al. Oncol Lett. .

Abstract

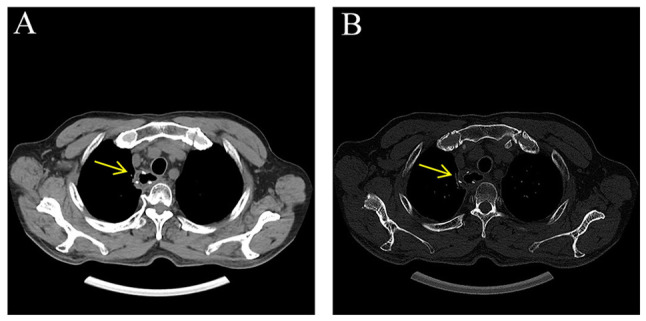
With the wide application of radiation therapy for malignant tumors and the continuous improvement of comprehensive treatment effect, the survival period of patients has been prolonged, while the incidence of radiation-induced osteosarcoma (RIOS) has gradually increased. Compared with primary osteosarcoma, RIOS has a higher degree of malignancy and poorer prognosis, severely impacting patient survival. Currently, there are relatively few case reports on RIOS and the understanding of its imaging characteristics remains incomplete. A patient with esophageal cancer who was found to have thoracic paravertebral masses six years after receiving radiotherapy was encountered at Zhuji People's Hospital (Zhuji, China). Computed tomography (CT), magnetic resonance imaging and positron emission tomography/CT all indicated the presence of the malignant tumors. Subsequently, the patient was hospitalized for CT-guided puncture biopsy of thoracic paravertebral masses. Through multidisciplinary discussions in the departments of Medical Oncology, Orthopedics, Radiology and Pathology, a consensus was finally reached on RIOS. In conclusion, RIOS is a severe and relatively rare complication of radiotherapy with a poor prognosis. In its early stage, it is easily confused with bone changes after radiotherapy and appearance deformities after surgery. Neoplastic bone is the primary imaging feature of RIOS of esophageal cancer. By combining the patient's radiotherapy history and laboratory examinations, the diagnostic accuracy for this disease could be improved.

Keywords: CT; MRI; PET/CT; radiation-induced osteosarcoma; radiotherapy.


Conflict of interest statement

The authors declare that they have no competing interests.

Figures

Figure 1. Target area and dose distribution map after esophageal cancer surgery. The yellow area represents the 4,500 cGy dose distribution area, which highly overlaps with the osteosarcoma area.
Figure 1.
Target area and dose distribution map after esophageal cancer surgery. The yellow area represents the 4,500 cGy dose distribution area, which highly overlaps with the osteosarcoma area.
Figure 2. CT images of esop hageal cancer. (A) Plain scan shows focal thickening of the middle thoracic esophagus. (B and C) Enhanced images show moderate enhancement of the middle thoracic esophagus ...
Figure 2.
CT images of esophageal cancer. (A) Plain scan shows focal thickening of the middle thoracic esophagus. (B and C) Enhanced images show moderate enhancement of the middle thoracic esophagus (the yellow arrow points at the cancerous lesion). (B) Arterial phase: The lesion exhibits mild enhancement, with the degree of enhancement generally lower than that of the normal esophageal wall. (C) Venous phase: The lesion shows persistent enhancement, slightly increased compared to the arterial phase but still less than the normal esophageal wall enhancement.
Figure 3. CT images after the surgery for esophageal cancer. (A) Mediastinal window on chest CT plain scan indicating no significant thickening of the anastomotic canal wall. (B) No obvious bone abnor...
Figure 3.
CT images after the surgery for esophageal cancer. (A) Mediastinal window on chest CT plain scan indicating no significant thickening of the anastomotic canal wall. (B) No obvious bone abnormalities of the thoracic vertebrae were found in the bone window (the yellow arrow indicates the anastomosis site after surgery).
Figure 4. Postoperative CT images of esophageal carcinoma. (A) Thoracic spine CT scan shows no significant thickening of the anastomotic wall (fine arrow), with irregular dense shadows observed near t...
Figure 4.
Postoperative CT images of esophageal carcinoma. (A) Thoracic spine CT scan shows no significant thickening of the anastomotic wall (fine arrow), with irregular dense shadows observed near the right edge of the thoracic vertebra (coarse arrow); the margins are indistinct and blurred, with patchy high-density tumor ossification visible internally. (B) Thoracic spine CT scan reveals no significant thickening of the anastomotic wall (fine arrow), with irregular dense shadows near the right edge of the thoracic vertebra (coarse arrow) and a central patchy low-density area. Sclerosis of the adjacent vertebral bodies and ribs is also present. CT, computed tomography
Figure 5. MR image of after esophageal cancer surgery. (A) T2WI shows that no obvious thickening of the anastomotic tube wall (thin arrow) and mass shadows (thick arrow) with patches of low signal can...
Figure 5.
MR image of after esophageal cancer surgery. (A) T2WI shows that no obvious thickening of the anastomotic tube wall (thin arrow) and mass shadows (thick arrow) with patches of low signal can be seen inside. (B) T1WI shows that the lesion is located near the right margin of thoracic vertebrae 3–5 with a less equal signal. (C) Enhanced transverse view and (D) enhanced sagittal view scans demonstrate the lesion (indicated by the thick arrow) exhibiting marked heterogeneous enhancement, with the peripheral enhancement significantly more pronounced than the central area. The margins are ill-defined and the lesion involves adjacent vertebral bodies and ribs. T1WI, T1-weighted imaging.
Figure 6. 18 F–FDG–PET / CT sc an. Upper left, CT axial image demonstrating an irregular, dense lesion near the right lateral border of the thoracic vertebrae (T3–T5), measuring ~2.4×3.9×4.5 cm, with ...
Figure 6.
18F-FDG-PET/CT scan. Upper left, CT axial image demonstrating an irregular, dense lesion near the right lateral border of the thoracic vertebrae (T3-T5), measuring ~2.4×3.9×4.5 cm, with indistinct and blurred margins. Upper right, PET image showing a conspicuous irregularly shaped high FDG uptake area corresponding to the lesion seen on the CT, with SUVmax/average=14.8/9.7. Lower left, fused PET/CT image revealing complete concordance between the abnormal dense lesion on CT and the high FDG uptake region on PET. Lower right, PET Maximum Intensity Projection image displaying the distribution of FDG uptake throughout the body, with a prominent hypermetabolic lesion in the thoracic region (corresponding to T3-T5). FDG, fluorodeoxyglucose; PET, positron emission tomography; CT, computed tomography; SUV, standardized uptake value; max, maximum; avg, average.
Figure 7. Puncture patholog y showed that the lesion tissue contained anaplastic sarcoma cells and osteoid matrix produced by sarcoma cells. The anaplastic sarcoma cells were fusiform, round–like, wit...
Figure 7.
Puncture pathology showed that the lesion tissue contained anaplastic sarcoma cells and osteoid matrix produced by sarcoma cells. The anaplastic sarcoma cells were fusiform, round-like, with medium eosinophilic cytoplasm, obvious nuclear atypia and giant tumor cells. Eosinophilic neoplastic braided bone and osteoid matrix can be seen in the sarcoma cells and there is no osteoblast coating around it (H&E; magnification, ×100).
Figure 8. Immunohistochemical images: (A) Ki67 (~50% of cell nuclei are positive); (B) CD138 cell membrane positive (magnification, ×100; scale bars, 200 µm).
Figure 8.
Immunohistochemical images: (A) Ki67 (~50% of cell nuclei are positive); (B) CD138 cell membrane positive (magnification, ×100; scale bars, 200 µm).

Similar articles

References

    1. Baskar R, Lee KA, Yeo R, Yeoh KW. Cancer and radiation therapy: Current advances and future directions. Int J Med Sci. 2012;9:193–199. doi: 10.7150/ijms.3635. - DOI - PMC - PubMed
    1. Abshire D, Lang MK. The evolution of radiation therapy in treating cancer. Semin Oncol Nurs. 2018;34:151–157. doi: 10.1016/j.soncn.2018.03.006. - DOI - PubMed
    1. Ozpiskin OM, Zhang L, Li JJ. Immune targets in the tumor microenvironment treated by radiotherapy. Theranostics. 2019;9:1215–1231. doi: 10.7150/thno.32648. - DOI - PMC - PubMed
    1. Coppa ND, Raper DM, Zhang Y, Collins BT, Harter KW, Gagnon GJ, Collins SP, Jean WC. Treatment of malignant tumors of the skull base with multi-session radiosurgery. J Hematol Oncol. 2009;2:16. doi: 10.1186/1756-8722-2-16. - DOI - PMC - PubMed
    1. Olivares-Urbano MA, Griñán-Lisón C, Marchal JA, Núñez MI. CSC radioresistance: A therapeutic challenge to improve radiotherapy effectiveness in cancer. Cells. 2020;9:1651. doi: 10.3390/cells9071651. - DOI - PMC - PubMed

Publication types

LinkOut - more resources