. 2025 Aug 20;6(8):102729.
doi: 10.1016/j.xcrp.2025.102729.

A percolating path to green iron

Affiliations

A percolating path to green iron

Subhechchha Paul et al. Cell Rep Phys Sci. .

Abstract

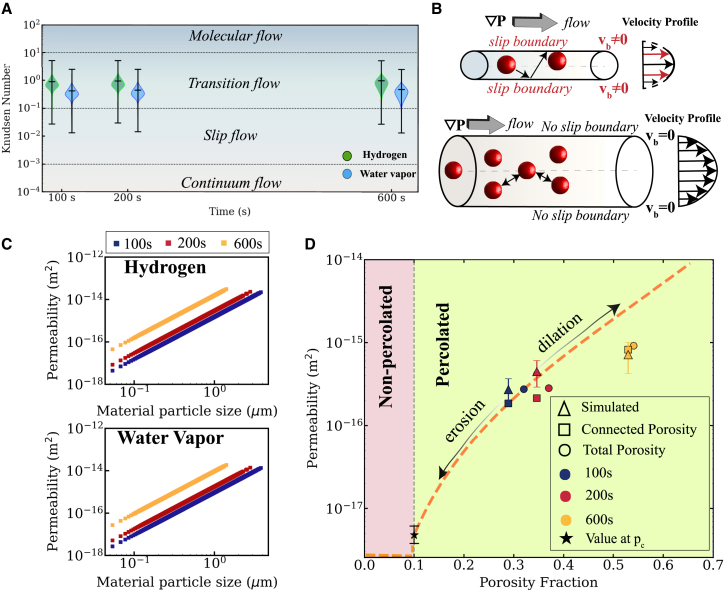
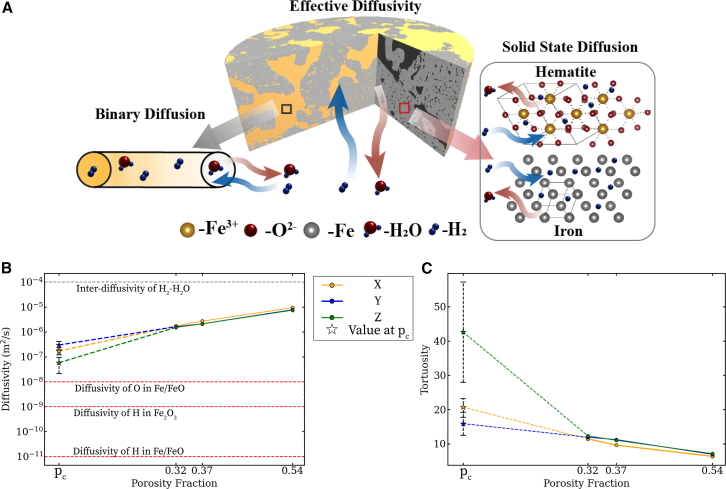
About 1.9 gigatons of steel is produced every year, emitting 8% (3.6 gigatons) of global CO2 in the process. More than 50% of the CO2 emissions come from a single step of steel production, known as ironmaking. Hydrogen-based direct reduction (HyDR) of iron oxide to iron has emerged as an emission-free ironmaking alternative. However, multiple physical and chemical phenomena ranging from nanometers to meters inside HyDR reactors alter the microstructure and pore networks in iron oxide pellets, in ways that resist gaseous transport of H2/H2O, slow reaction rates, and disrupt continuous reactor operation. Using synchrotron nano X-ray computed tomography and percolation theory, we quantify the evolution of pores in iron oxide pellets and demonstrate how nanoscale pore connectivity influences micro- and macroscale flow properties such as permeability, diffusivity, and tortuosity. Our modeling framework connects disparate scales and offers opportunities to accelerate HyDR.

Keywords: hydrogen; ironmaking; percolation; pores.


Conflict of interest statement

The authors declare no competing interests.

Figures

None
Graphical abstract
Figure 1
Figure 1
Pore morphology and evolution with reduction (A) Reconstructed volumes from nano-XCT scans of iron oxide pellets after 100 s of reduction (material, gray; pores, brown). (B) Pore (white) evolution as observed in 2D image slices for 100 s, 200 s, and 600 s. (C) Porosity fraction from the reconstructed nano-XCT and 2D porosity slices. (D) Heterogeneous pore networks in iron oxide represented as throats and pores.
Figure 2
Figure 2
Determining state of percolation (A) Micro-XCT reconstructed volume of an entire direct reduction pellet along with a 2D slice and extracted pore network model (for full pellet) computed using OpenPNM. (B) Cluster size distribution of pores extracted from the nano-XCT volumes. Cluster size is computed as the number of pores constituting a particular cluster and is dimensionless. (C) Tracking reduction in porosity fraction using the erosion operator to simulate nonpercolated pore networks from percolated pore networks. Orange network images display the porosity fraction measured at 100 s (p = 0.32), the network after 32 isotropic erosion steps for p = pc, and finally the subpercolated network at p = 0.09. Data at pc are represented as mean ± SD.
Figure 3
Figure 3
Evaluating flow properties (A) Violin plot displays the distribution of Knudsen number for hydrogen (green) and water vapor (blue) for each time point. The width of the violin indicates data density; central line shows mean, and the extrema lines represent minimum and maximum values. (B) Slip and no-slip effects from the perspective of gas collisions. (C) Variation in permeability of hydrogen and water vapor with iron oxide particles that constitute the pellets. (D) Permeability evaluation to capture the effect of pore connectivity. At pc, mean permeability is shown with corresponding maximum and minimum values, while simulated permeability values are shown as mean ± SD.
Figure 4
Figure 4
Evaluating diffusion and tortuosity (A) Microscale-nanoscale flow mechanism. (B) Comparing effective diffusion of gas through the pellet with interdiffusivity and solid-state diffusion. (C) Tortuosity calculated based on effective diffusivity from tpc to 600 s. All data are plotted with mean (marker), maximum, and minimum values.

References

    1. World Steel Association World steel in figures 2024 Tech. Rep. 2024. https://worldsteel.org/media/publications/world-steel-in-figures-2024/
    1. World Economic Forum Net-zero industry tracker 2023. 2023. https://www.weforum.org/publications/net-zero-industry-tracker-2023/
    1. Levi P., Vass T., Mandová H., Gouy A. IEA: Tracking Industry - International Energy Agency. 2020. https://policycommons.net/artifacts/1343342/tracking-industry-2020/1955485/
    1. IEA Iron and Steel Technology Roadmap. 2020. https://www.iea.org/reports/iron-and-steel-technology-roadmap
    1. International Renewable Energy Agency Renewable Power Generation Costs in 2022. 2022. https://www.irena.org/publications/2023/Aug/Renewable-power-generation-c...

LinkOut - more resources