

Study of Metabolite Detectability in Simultaneous Profiling of Amine/Phenol and Hydroxyl Submetabolomes by Analyzing a Mixture of Two Separately Dansyl-Labeled Samples
- PMID: 40863114
- PMCID: PMC12388855
- DOI: 10.3390/metabo15080496
Study of Metabolite Detectability in Simultaneous Profiling of Amine/Phenol and Hydroxyl Submetabolomes by Analyzing a Mixture of Two Separately Dansyl-Labeled Samples
Abstract
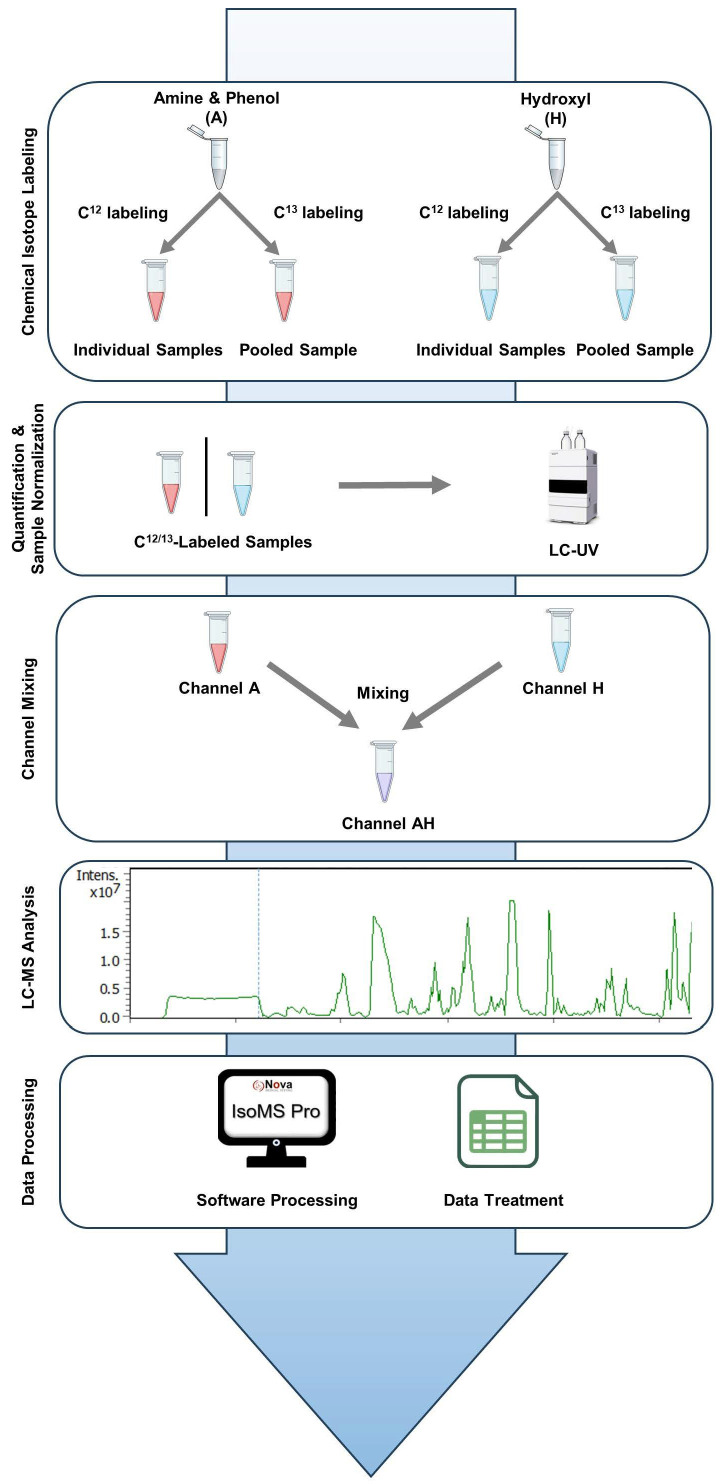
Background: Liquid chromatography-mass spectrometry (LC-MS), widely used in metabolomics, is often limited by low ionization efficiency and ion suppression, which reduce overall metabolite detectability and quantification accuracy. To address these challenges, chemical isotope labeling (CIL) LC-MS has emerged as a powerful approach, offering high sensitivity, accurate quantification, and broad metabolome coverage. This method enables comprehensive profiling by targeting multiple submetabolomes. Specifically, amine-/phenol- and hydroxyl-containing metabolites are labeled using dansyl chloride under distinct reaction conditions. While this strategy provides extensive coverage, the sequential analysis of each submetabolome reduces throughput. To overcome this limitation, we propose a two-channel mixing strategy to improve analytical efficiency.
Methods: In this approach, samples labeled separately for the amine/phenol and hydroxyl submetabolomes are combined prior to LC-MS analysis, leveraging the common use of dansyl chloride as the labeling reagent. This integration effectively doubles throughput by reducing LC-MS runtime and associated costs. The method was evaluated using human urine and serum samples, focusing on peak pair detectability and metabolite identification. A proof-of-concept study was also conducted to assess the approach's applicability in putative biomarker discovery.
Results: Results demonstrate that the two-channel mixing strategy enhances throughput while maintaining analytical robustness.
Conclusions: This method is particularly suitable for large-scale studies that require rapid sample processing, where high efficiency is essential.
Keywords: chemical isotope labeling (CIL) LC-MS; comprehensive metabolome profiling; dansyl labeling; rapid sample processing.
Conflict of interest statement
The authors declare no conflicts of interest.
Figures


Similar articles
-
Prescription of Controlled Substances: Benefits and Risks.2025 Jul 6. In: StatPearls [Internet]. Treasure Island (FL): StatPearls Publishing; 2025 Jan–. 2025 Jul 6. In: StatPearls [Internet]. Treasure Island (FL): StatPearls Publishing; 2025 Jan–. PMID: 30726003 Free Books & Documents.
-
4-plex quantitative glycoproteomics using glycan/protein-stable isotope labeling in cell culture.J Proteomics. 2025 Jan 6;310:105333. doi: 10.1016/j.jprot.2024.105333. Epub 2024 Oct 18. J Proteomics. 2025. PMID: 39426592
-
[Fast determination of per- and polyfluoroalkyl substances in human serum by cold-induced phase separation coupled with liquid chromatography-tandem mass spectrometry].Se Pu. 2025 Jul;43(7):756-766. doi: 10.3724/SP.J.1123.2024.11028. Se Pu. 2025. PMID: 40610770 Free PMC article. Chinese.
-
The effect of sample site and collection procedure on identification of SARS-CoV-2 infection.Cochrane Database Syst Rev. 2024 Dec 16;12(12):CD014780. doi: 10.1002/14651858.CD014780. Cochrane Database Syst Rev. 2024. PMID: 39679851 Free PMC article.
-
Signs and symptoms to determine if a patient presenting in primary care or hospital outpatient settings has COVID-19.Cochrane Database Syst Rev. 2022 May 20;5(5):CD013665. doi: 10.1002/14651858.CD013665.pub3. Cochrane Database Syst Rev. 2022. PMID: 35593186 Free PMC article.
References
-
- Broeckling C.D., Beger R.D., Cheng L.L., Cumeras R., Cuthbertson D.J., Dasari S., Davis W.C., Dunn W.B., Evans A.M., Fernández-Ochoa A., et al. Current Practices in LC-MS Untargeted Metabolomics: A Scoping Review on the Use of Pooled Quality Control Samples. Anal. Chem. 2023;95:18645–18654. doi: 10.1021/acs.analchem.3c02924. - DOI - PMC - PubMed
Grants and funding
LinkOut - more resources
Full Text Sources
Medical
