. 2025 Jul 29;13(8):638.
doi: 10.3390/toxics13080638.

Spatiotemporal Analysis of BTEX and PM Using Me-DOAS and GIS in Busan's Industrial Complexes

Affiliations

Spatiotemporal Analysis of BTEX and PM Using Me-DOAS and GIS in Busan's Industrial Complexes

Min-Kyeong Kim et al. Toxics. .

Abstract

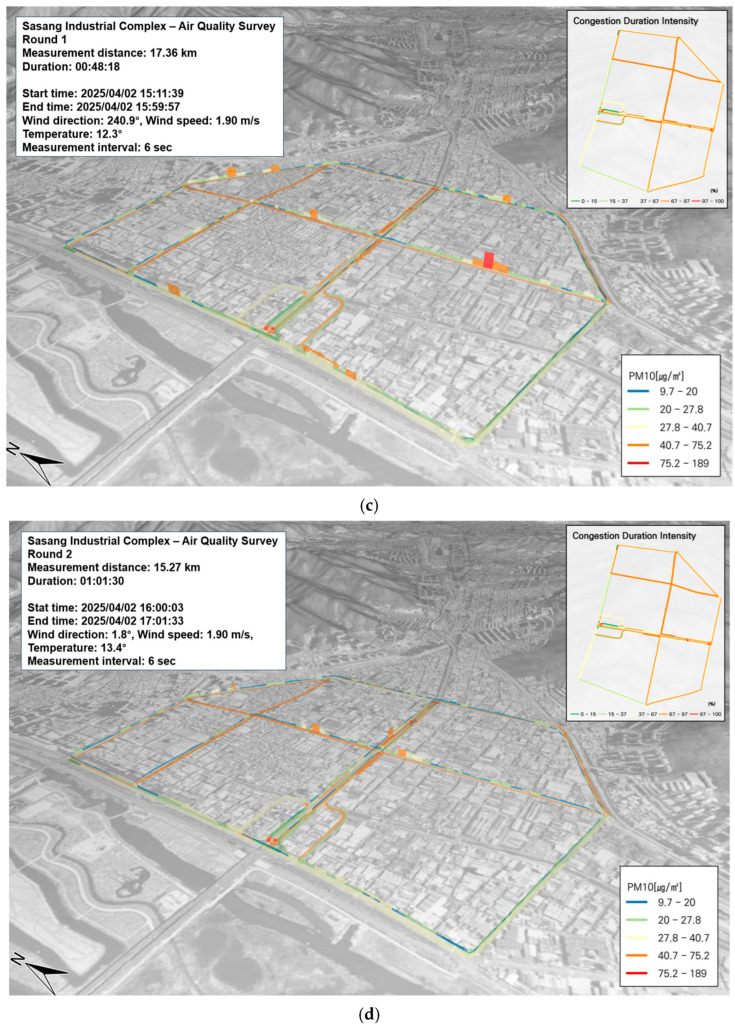
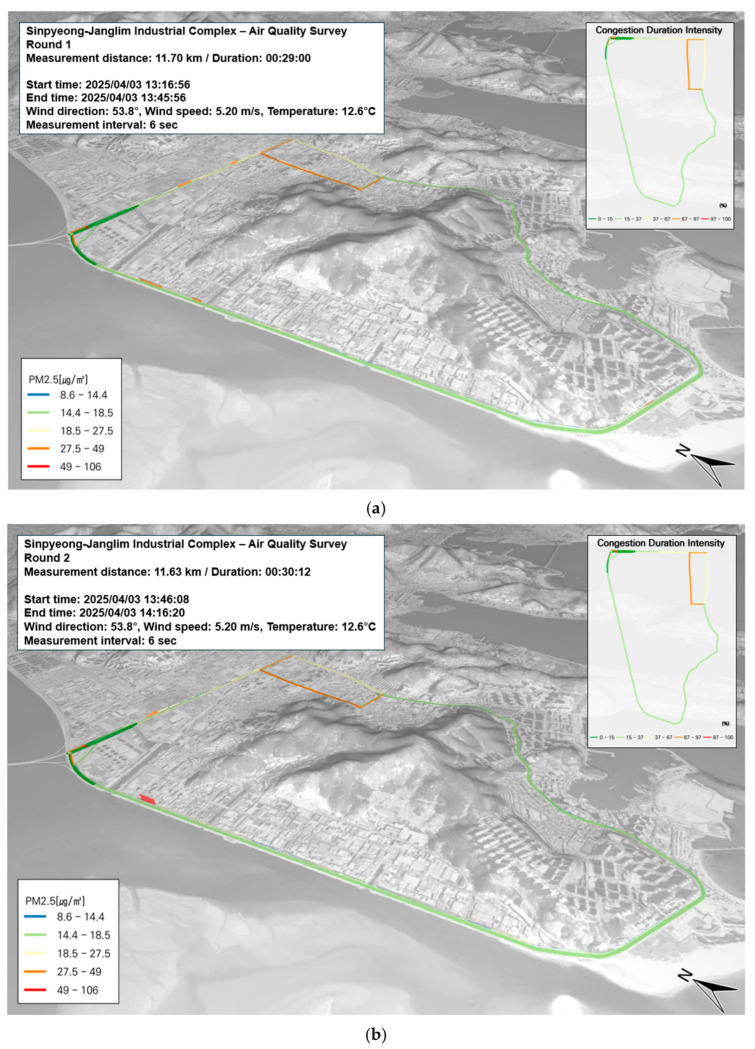
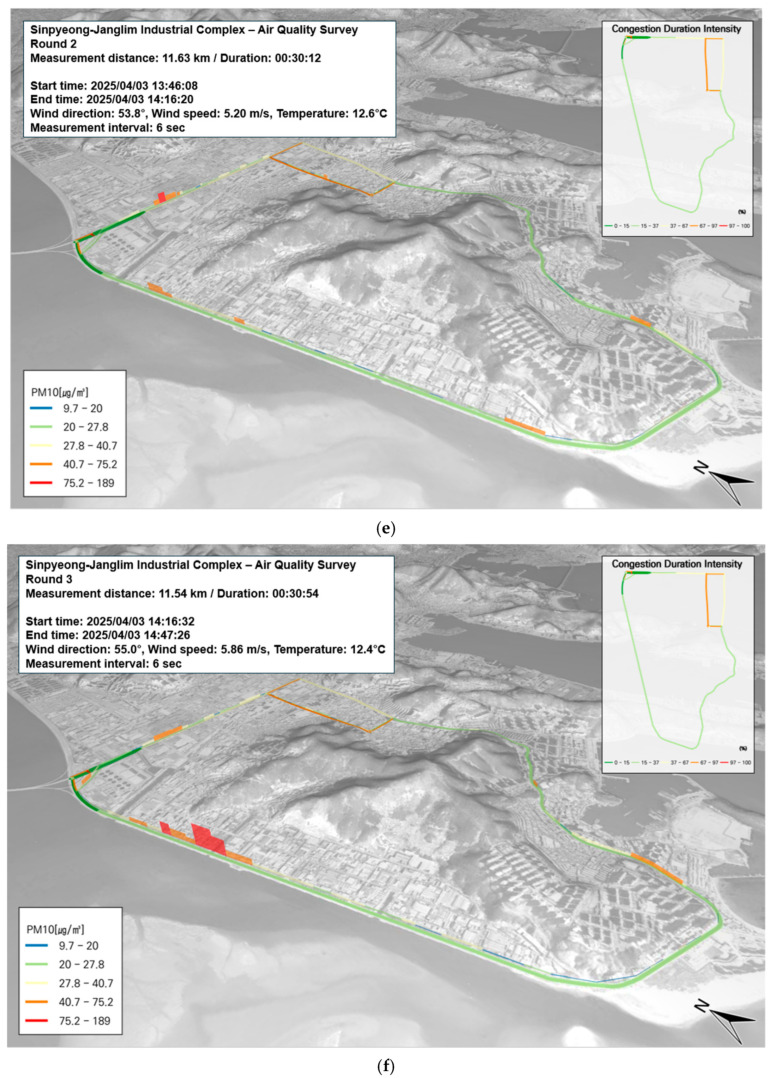
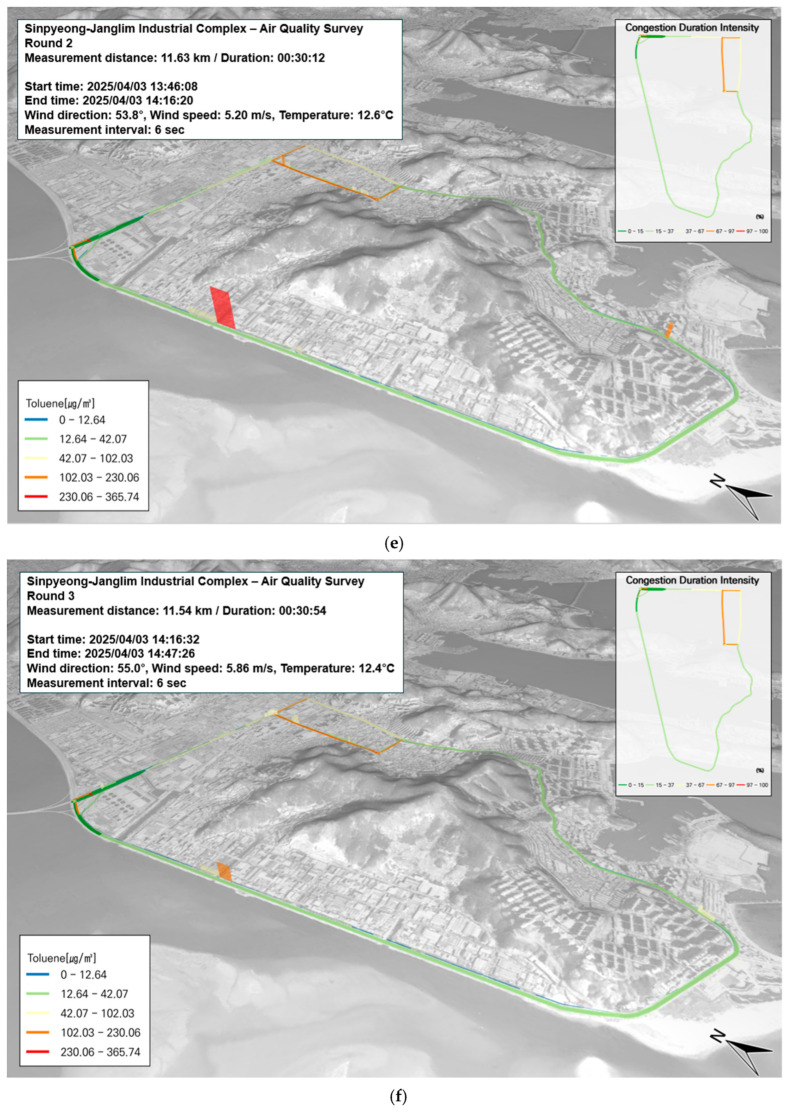
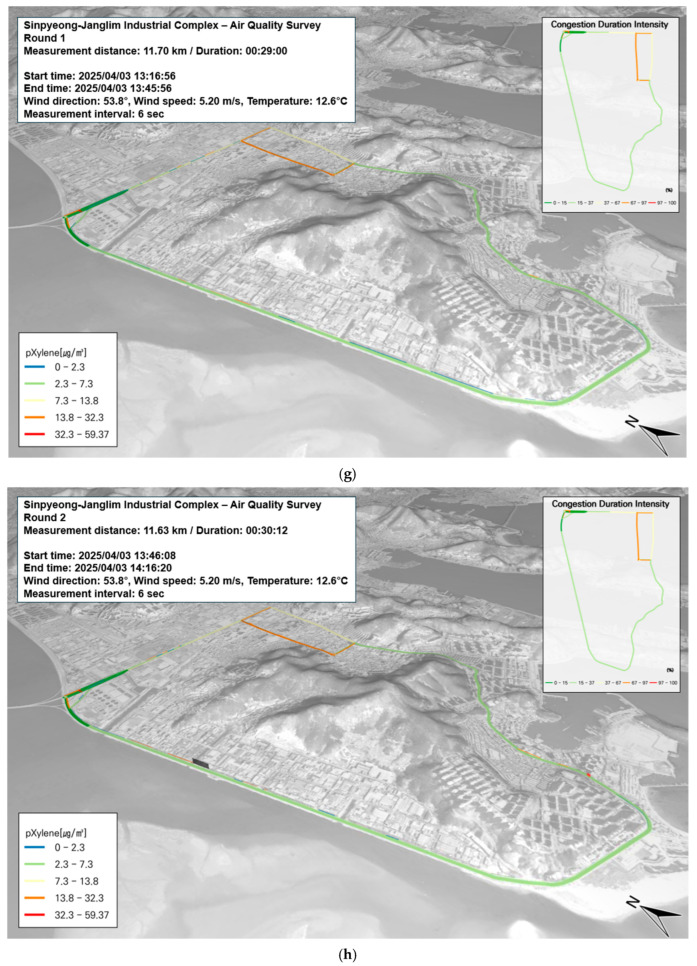
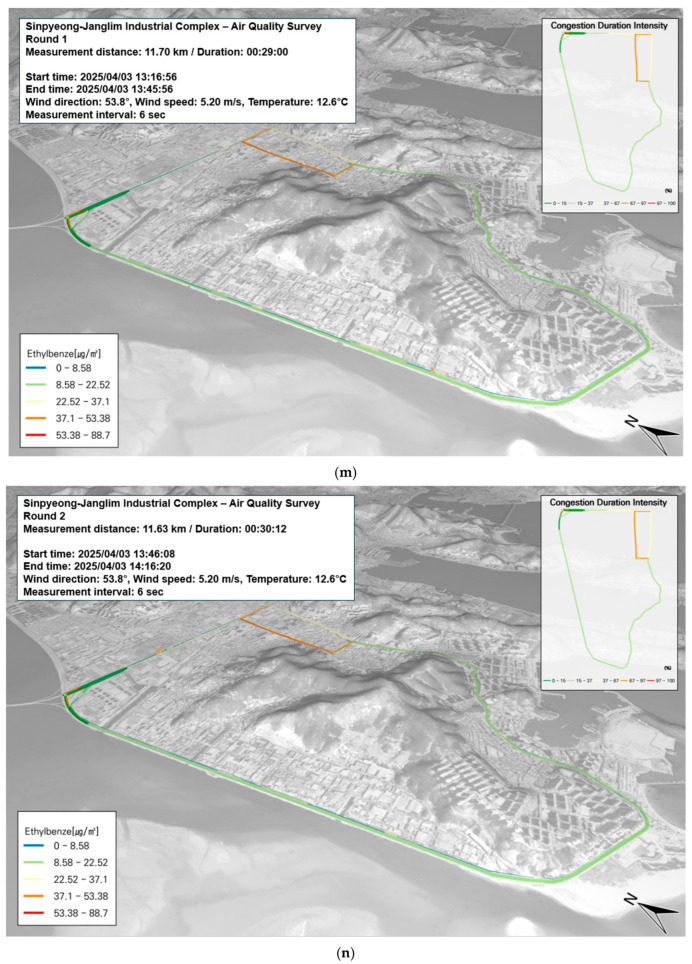
Rapid industrialization and urbanization have progressed in Korea, yet public attention to hazardous pollutants emitted from industrial complexes remains limited. With the increasing coexistence of industrial and residential areas, there is a growing need for real-time monitoring and management plans that account for the rapid dispersion of hazardous air pollutants (HAPs). In this study, we conducted spatiotemporal data collection and analysis for the first time in Korea using real-time measurements obtained through mobile extractive differential optical absorption spectroscopy (Me-DOAS) mounted on a solar occultation flux (SOF) vehicle. The measurements were conducted in the Saha Sinpyeong-Janglim Industrial Complex in Busan, which comprises the Sasang Industrial Complex and the Sinpyeong-Janglim Industrial Complex. BTEX compounds were selected as target volatile organic compounds (VOCs), and real-time measurements of both BTEX and fine particulate matter (PM) were conducted simultaneously. Correlation analysis revealed a strong relationship between PM10 and PM2.5 (r = 0.848-0.894), indicating shared sources. In Sasang, BTEX levels were associated with traffic and localized facilities, while in Saha Sinpyeong-Janglim, the concentrations were more influenced by industrial zoning and wind patterns. Notably, inter-compound correlations such as benzene-m-xylene and p-xylene-toluene suggested possible co-emission sources. This study proposes a GIS-based, three-dimensional air quality management approach that integrates variables such as traffic volume, wind direction, and speed through real-time measurements. The findings are expected to inform effective pollution control strategies and future environmental management plans for industrial complexes.

Keywords: 3D geographic information system (GIS); BTEX; Busan industrial complex; hotspot analysis; mobile extractive differential optical absorption spectroscopy (Me-DOAS); solar occultation flux (SOF); volatile organic compounds (VOCs).


Conflict of interest statement

The authors declare that they have no conflicts of interest to report.

Figures

Figure 1
Figure 1
Study site locations and SOF (solar occultation flux) vehicle measurement routes.
Figure 2
Figure 2
Me-DOAS measurement system mounted on the SOF (solar occultation flux) vehicle.
Figure 3
Figure 3
Spatial and temporal distribution of PM2.5 and PM10 concentrations on 2 April: (a) PM2.5, first run; (b) PM2.5, second run; (c) PM10, first run; (d) PM10, second run.
Figure 3
Figure 3
Spatial and temporal distribution of PM2.5 and PM10 concentrations on 2 April: (a) PM2.5, first run; (b) PM2.5, second run; (c) PM10, first run; (d) PM10, second run.
Figure 4
Figure 4
Temporal and spatial distribution of VOCs (BTEX) from mobile measurements conducted on 2 April: (a) benzene, first run; (b) benzene, second run; (c) toluene, first run; (d) toluene, second run; (e) p-Xylene, first run; (f) p-Xylene, second run; (g) m-Xylene, first run; (h) m-Xylene, second run; (i) ethylbenzene, first run; (j) ethylbenzene, second run.
Figure 4
Figure 4
Temporal and spatial distribution of VOCs (BTEX) from mobile measurements conducted on 2 April: (a) benzene, first run; (b) benzene, second run; (c) toluene, first run; (d) toluene, second run; (e) p-Xylene, first run; (f) p-Xylene, second run; (g) m-Xylene, first run; (h) m-Xylene, second run; (i) ethylbenzene, first run; (j) ethylbenzene, second run.
Figure 5
Figure 5
Spatial and temporal distribution of PM2.5 and PM10 concentrations on 3 April: (ac) PM2.5, first to third runs; (df) PM10, first to third runs.
Figure 5
Figure 5
Spatial and temporal distribution of PM2.5 and PM10 concentrations on 3 April: (ac) PM2.5, first to third runs; (df) PM10, first to third runs.
Figure 5
Figure 5
Spatial and temporal distribution of PM2.5 and PM10 concentrations on 3 April: (ac) PM2.5, first to third runs; (df) PM10, first to third runs.
Figure 6
Figure 6
Temporal and spatial distribution of BTEX compounds (VOC) on 3 April: (ac) benzene—first to third runs; (df) toluene—first to third runs; (gi) p-Xylene—first to third runs; (jl) m-Xylene—first to third runs; (mo) ethylbenzene—first to third runs.
Figure 6
Figure 6
Temporal and spatial distribution of BTEX compounds (VOC) on 3 April: (ac) benzene—first to third runs; (df) toluene—first to third runs; (gi) p-Xylene—first to third runs; (jl) m-Xylene—first to third runs; (mo) ethylbenzene—first to third runs.
Figure 6
Figure 6
Temporal and spatial distribution of BTEX compounds (VOC) on 3 April: (ac) benzene—first to third runs; (df) toluene—first to third runs; (gi) p-Xylene—first to third runs; (jl) m-Xylene—first to third runs; (mo) ethylbenzene—first to third runs.
Figure 6
Figure 6
Temporal and spatial distribution of BTEX compounds (VOC) on 3 April: (ac) benzene—first to third runs; (df) toluene—first to third runs; (gi) p-Xylene—first to third runs; (jl) m-Xylene—first to third runs; (mo) ethylbenzene—first to third runs.
Figure 6
Figure 6
Temporal and spatial distribution of BTEX compounds (VOC) on 3 April: (ac) benzene—first to third runs; (df) toluene—first to third runs; (gi) p-Xylene—first to third runs; (jl) m-Xylene—first to third runs; (mo) ethylbenzene—first to third runs.
Figure 6
Figure 6
Temporal and spatial distribution of BTEX compounds (VOC) on 3 April: (ac) benzene—first to third runs; (df) toluene—first to third runs; (gi) p-Xylene—first to third runs; (jl) m-Xylene—first to third runs; (mo) ethylbenzene—first to third runs.
Figure 6
Figure 6
Temporal and spatial distribution of BTEX compounds (VOC) on 3 April: (ac) benzene—first to third runs; (df) toluene—first to third runs; (gi) p-Xylene—first to third runs; (jl) m-Xylene—first to third runs; (mo) ethylbenzene—first to third runs.
Figure 6
Figure 6
Temporal and spatial distribution of BTEX compounds (VOC) on 3 April: (ac) benzene—first to third runs; (df) toluene—first to third runs; (gi) p-Xylene—first to third runs; (jl) m-Xylene—first to third runs; (mo) ethylbenzene—first to third runs.

References

    1. Korea Industrial Complex Corporation (KICOX) 2024. [(accessed on 3 April 2025)]. Available online: https://www.kicox.or.kr/index.do.
    1. World Health Organization (WHO) Air Quality Guidelines for Europe. WHO; Geneva, Switzerland: 2000.
    1. Che J.S., Che J.M., Jeon J.M., Kang B.W., Kim J.H., Moon K.J., Park K.T., Kang D.I. The study on emission characteristics of gas-phase hazardous air pollutants generated at the large-scale industrial complexes. J. Korean Soc. Atmos. Environ. 2024;40:27–47. doi: 10.5572/KOSAE.2024.40.1.27. (In Korean) - DOI
    1. Lee T.J., Lee S.M., Chae J.S., Jeon J.M., Kim D.S., Jo Y.M. Inventory of ozone precursor VOCs from organic solvents used in residential workplaces and assessment of ozone formation contribution. J. Korean Soc. Atmos. Environ. 2021;37:102–112. doi: 10.5572/KOSAE.2021.37.1.102. (In Korean) - DOI
    1. Seo Y.K., Chung S.H., Baek S.O. Current status and prospective of hazardous VOC in ambient air. J. Korean Soc. Atmos. Environ. 2011;27:734–745. doi: 10.5572/KOSAE.2011.27.6.734. (In Korean) - DOI

LinkOut - more resources