. 2025 Aug 20;13(8):699.
doi: 10.3390/toxics13080699.

Toxicological Mechanisms of Uranium-Induced Apoptosis in HK-2 Cells: A Proteomics and Metabolomics Study

Affiliations

Toxicological Mechanisms of Uranium-Induced Apoptosis in HK-2 Cells: A Proteomics and Metabolomics Study

Zihuan Wang et al. Toxics. .

Abstract

The rapid development of the nuclear industry and mining has increased environmental radioactive contamination, posing potentially ecological risks and health threats to humans. Uranium compounds are known to exhibit selective nephrotoxicity, but their toxicological processes and mechanisms still remain poorly understood and controversial. In this study, the uranyl-induced toxicity in human renal tubular epithelial cells (HK-2) were explored using flow cytometry, DAPI staining, and comet assays. Our results demonstrate that uranium exposure primarily triggers apoptosis. Kyoto Encyclopedia of Genes and Genomes pathway enrichment and protein-protein interaction (PPI) analyses revealed significant associations with DNA damage. Moreover, aberrant expression of ABC transporters (e.g., ABCB7) and mitochondrial-related proteins confirms uranium-induced mitochondrial dysfunction. Gene Ontology functional annotation implicated extrinsic apoptotic signaling pathways in uranium-induced cell death. The downregulation of the UBL5 protein also pointed to endoplasmic reticulum stress-mediated apoptosis. In summary, uranium exposure can induce the apoptosis of HK-2 cells through intrinsic pathways by damaging DNA and mitochondria and disrupting protein synthesis, with secondary contributions from endoplasmic reticulum stress and extrinsic apoptotic signaling.

Keywords: HK-2 cell; apoptosis; metabolomics; proteomics; uranium.


Conflict of interest statement

The authors declare that they have no known competing financial interests or personal relationships that could have appeared to influence the work reported in this paper.

Figures
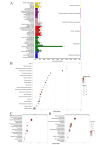
Figure 5
Figure 5
KEGG difference for protein enrichment of annotation and KEGG pathway enrichment map. (A) Differential protein KEGG pathway classification bar chart. (B) The KEGG pathway enrichment map (summary). (C) The KEGG pathway enrichment map (downregulated DEPs). (D) The KEGG pathway enrichment map (upregulated DEPs).
Figure 6
Figure 6
GO and COG analysis. (A) Gene Ontology (GO). (B) COG annotation.
Figure 1
Figure 1
Uranium-reduced cell viability in HK-2 cells. (A) Cells were treated with different uranium level for 24 h, and viability was examined with the CCK-8 method. * p < 0.05, **** p < 0.0001. (B) The IC50 value of HK-2 cells after uranium treatment was 725.1 μM.
Figure 2
Figure 2
Toxicity of uranyl nitrate on HK-2 cells. (A) Flow cytometry with annexin V/PI. (B) AO/PI fluorescence staining. Green cells were viable cells (VC), yellow cells were early apoptotic cells (EA), orange cells were late apoptotic cells (LA), and red cells were necrotic cells (N). (C) Cell cycle of HK-2 cells after uranyl nitrate exposure. The sub-G1 peak is marked in red boxes. (D) DAPI staining. The yellow arrows indicate nucleoplasmic aggregation, the red arrows indicate apoptotic bodies, and the living cells are marked by white arrows. The ruler length was 100 μM.
Figure 3
Figure 3
Comet assay. Uranium was exposed for 24 h (A) and 48 h (B), respectively. The ruler length was 100 μm.
Figure 4
Figure 4
Proteomics of differentially expressed proteins in HK-2 cells exposed to 800 μM uranyl nitrate. (A) Clustering heat map. (B) PCA. (C) Volcano plot.
Figure 7
Figure 7
Proteomic interaction network. (A) Cyclic graph shows the difference in protein interaction. (B) The top ten hub proteins with the closest protein interaction.
Figure 8
Figure 8
KEGG map of differentially changed metabolites (A) KEGG annotation enrichment analysis. The control group and 800 μM group were compared to select differentially changed metabolites. (B) KEGG pathway enrichment analysis. Summarizes the significance of top 20 pathways.

References

    1. Appleton J.D. Radon: Sources, health risks, and hazard mapping. Ambio. 2007;36:85–89. doi: 10.1579/0044-7447(2007)36[85:RSHRAH]2.0.CO;2. - DOI - PubMed
    1. Ma M., Wang R., Xu L., Xu M., Liu S. Emerging health risks and underlying toxicological mechanisms of uranium contamination: Lessons from the past two decades. Environ. Int. 2020;145:106107. doi: 10.1016/j.envint.2020.106107. - DOI - PubMed
    1. Wufuer R., Wei Y., Lin Q., Wang H., Song W., Liu W., Zhang D., Pan X., Gadd G.M. Uranium bioreduction and biomineralization. Adv. Appl. Microbiol. 2017;101:137–168. doi: 10.1016/bs.aambs.2017.01.003. - DOI - PubMed
    1. Babich R., Craig E., Muscat A., Disney J., Farrell A., Silka L., Jayasundara N. Defining drinking water metal contaminant mixture risk by coupling zebrafish behavioral analysis with citizen science. Sci. Rep. 2021;11:17303. doi: 10.1038/s41598-021-96244-4. - DOI - PMC - PubMed
    1. Arzuaga X., Rieth S.H., Bathija A., Cooper G.S. Renal effects of exposure to natural and depleted uranium: A review of the epidemiologic and experimental data. J. Toxicol. Environ. Health Part B Crit. Rev. 2010;13:527–545. doi: 10.1080/10937404.2010.509015. - DOI - PubMed

LinkOut - more resources