

Global, Regional, and National Burden of Blindness due to Diabetic Retinopathy, 1990-2021
- PMID: 40864420
- PMCID: PMC12413353
- DOI: 10.1007/s40123-025-01230-y
Global, Regional, and National Burden of Blindness due to Diabetic Retinopathy, 1990-2021
Abstract
Introduction: This study aimed to analyze the patterns and trends in the burden of blindness due to diabetic retinopathy (DR) from 1990 to 2021 at the global, regional, and national levels.
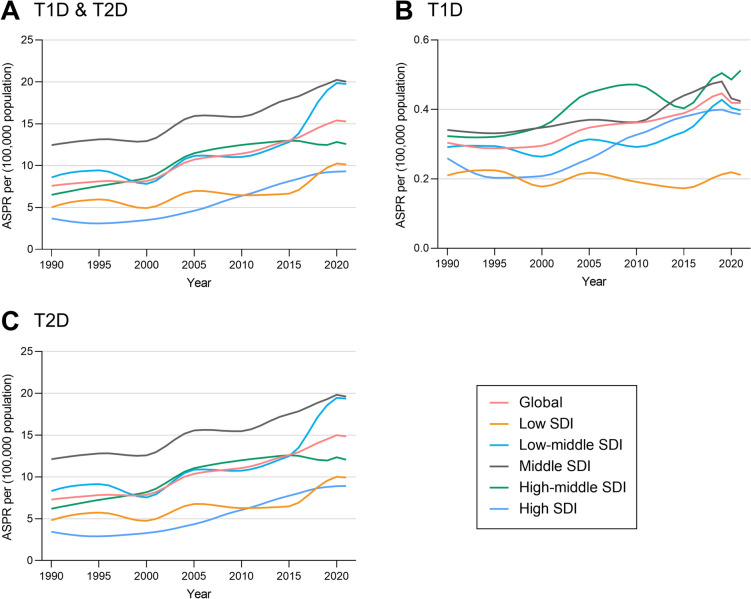
Methods: We conducted a population-based analysis using the latest data from the Global Burden of Disease Study 2021. We examined the prevalence and number of cases of DR-related blindness stratified by type of diabetes, sex, age, and sociodemographic index (SDI) level. The trends in the blindness burden were quantified via the average annual percentage changes. A decomposition analysis was performed to identify key drivers of the changing burden. A Bayesian age‒period‒cohort model was used to predict the future burden of DR-related blindness from 2022 to 2035.
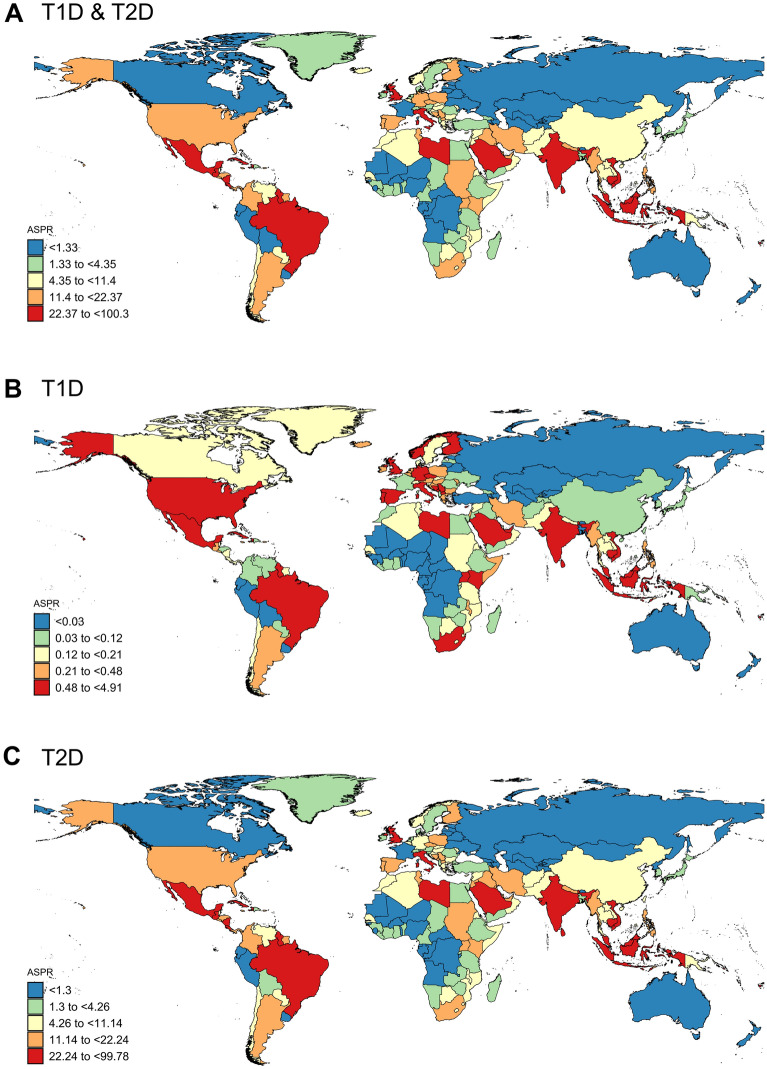
Results: Globally, the number of people blind due to DR increased by 326.0% from 1990 to 2021, with the age-standardized prevalence rate (ASPR) increasing from 7.59 to 15.28 per 100,000 population. Regionally, Tropical Latin America had the highest ASPR in 2021, whereas South Asia and East Asia had the greatest number of prevalent cases. Nationally, India and China had the highest number of prevalent cases in 2021, whereas Marshall Islands reported the highest ASPR. In 2021, the middle SDI group had the greatest number of patients who became blind due to DR. Decomposition analysis revealed that the increased global burden between 1990 and 2021 was driven by population growth, population aging, and epidemiological changes. Predictions suggest the burden will continue to rise through 2035.
Conclusions: The global burden of DR-related blindness has increased significantly over the past three decades, with notable disparities across regions, countries, and SDI groups. More efforts should be made to mitigate the growing impact of DR-related blindness.
Keywords: Blindness; Diabetes; Diabetic retinopathy; Epidemiology; GBD 2021.
© 2025. The Author(s).
Conflict of interest statement
Declarations. Conflict of Interest: Yang Meng, Yuan Liu, Yuan Ma, Ziye Chen, Runping Duan, Lan Jiang, and Tao Li have nothing to disclose. Ethical Approval: The Institutional Review Board Committee of the University of Washington approved the GBD 2021 (approval number: STUDY00009060). Since this study used de-identified data from GBD 2021, no additional ethics approval was needed.
Figures


Similar articles
-
Global, regional and national burden of blindness and vision loss attributable to diabetic retinopathy, 1990-2021: A systematic analysis for the Global Burden of Disease Study 2021.Diabetes Obes Metab. 2025 Oct;27(10):5464-5477. doi: 10.1111/dom.16588. Epub 2025 Jul 22. Diabetes Obes Metab. 2025. PMID: 40693378 Free PMC article.
-
Global burden of blindness or visually impairment attributable to diabetic retinopathy in the adults aged 70 years and older, 1990-2021: Results from the global burden of disease study in 2021.Diabetes Res Clin Pract. 2025 Aug;226:112383. doi: 10.1016/j.diabres.2025.112383. Epub 2025 Jul 24. Diabetes Res Clin Pract. 2025. PMID: 40714069
-
Global burden trends and future predictions of ischemic heart disease attributable to air pollution in people aged 60 years and older, 1990-2021.Front Public Health. 2025 Jul 4;13:1598092. doi: 10.3389/fpubh.2025.1598092. eCollection 2025. Front Public Health. 2025. PMID: 40687134 Free PMC article.
-
Burden of knee osteoarthritis in China and globally: 1990-2045.BMC Musculoskelet Disord. 2025 Jul 1;26(1):582. doi: 10.1186/s12891-025-08858-8. BMC Musculoskelet Disord. 2025. PMID: 40598022 Free PMC article.
-
National and subnational burden of brain and central nervous system cancers in China and global from 1990 to 2021: results from the global burden of disease study 2021.Arch Public Health. 2025 Jul 28;83(1):195. doi: 10.1186/s13690-025-01683-4. Arch Public Health. 2025. PMID: 40722045 Free PMC article.
References
-
- Shan Y, Xu Y, Lin X, Lou L, Wang Y, Ye J. Burden of vision loss due to diabetic retinopathy in China from 1990 to 2017: findings from the global burden of disease study. Acta Ophthalmol. 2021;99(2):e267–73. 10.1111/aos.14573. - PubMed
Grants and funding
LinkOut - more resources
Full Text Sources
Miscellaneous
