. 2025 Aug 29;11(35):eadw9952.
doi: 10.1126/sciadv.adw9952. Epub 2025 Aug 27.

Mitochondrial ROS drive foam cell formation via STAT5 signaling in atherosclerosis

Affiliations

Mitochondrial ROS drive foam cell formation via STAT5 signaling in atherosclerosis

Laura Boccuni et al. Sci Adv. .

Abstract

Macrophage-to-foam cell transition is an integral part of atherosclerotic plaque progression. Particularly, oxidized low-density lipoprotein (oxLDL) is a driving factor in foam cell formation, altering macrophage function and metabolism. The aim of our research was to understand the impact of oxLDL-induced mitochondrial reactive oxygen species on macrophage-to-foam cell differentiation. We demonstrate that macrophage oxLDL-derived superoxide modulates mitochondrial metabolic reprogramming, facilitating foam cell formation. Mechanistically, mitochondrial superoxide drives signal transducers and activators of transcription 5 (STAT5) activation, leading to reduced tricarboxylic acid cycle activity. In parallel, mitochondrial superoxide enhances chromatin accessibility at STAT5 target genes, establishing a distinct STAT5 signaling signature in foam cells ex vivo and in human and mouse plaques in vivo. Inhibition of STAT5 during atherosclerosis progression prevents the differentiation of macrophages to mature Trem2hiGpnmbhi foam cells. Collectively, our data describe an oxLDL-induced, mitochondrial superoxide-dependent STAT5 activation that leads to a self-amplifying feedback loop of reciprocal mitochondrial superoxide production and STAT5 activation, ultimately driving macrophage-to-foam cell transition.


Figures

Fig. 1.
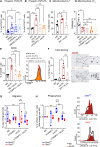
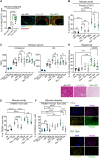
Fig. 1.. Atherosclerotic macrophages display elevated ROS-induced mitochondrial damage that gradually increases with atherosclerosis progression.
(A) oxLDL uptake in hMDMs treated with diluted (Dil)-oxLDL for 24 hours, measured by flow cytometry. Data are the MFI of PE-Texas Red signals. (B to D) CD36 (B), CD146 (C), and mitochondrial O2•− (MitoSOX red) (D) staining in hMDMs treated with oxLDL (24 hours), determined by flow cytometry. (D) shows a representative flow cytometry histogram. n ≥ 4. (E) MitoSOX red staining of CD45+ Ly6g Cd11b+ F4/80+ macrophages in the aorta, spleen, and bone marrow isolated from ApoE−/− mice fed with an HFD for 16 weeks. w, weeks. The right panels depict the gating strategy used for the characterization of aortic macrophages. Each dot, one mouse. n = 6. (F) Quantification of mitochondrial 8-oxog staining in mouse aortic plaques after 4, 10, and 16 weeks of HFD and gated from CD68+ signals (total macrophages). Each dot, one mouse. n = 5 (4-week HFD), n = 4 (10-week HFD), n = 9 (16-week HFD). (G to J) Quantification of mitochondrial 8-oxog staining in human carotid plaques gated from CD68+ (total macrophages) (G), CD68+CD80hi macrophages (H), CD68+CD206hi macrophages (I), and CD146+ foam cells (J). The right panel shows a representative image and a zoomed-in inset. Scale bars, 50 μm; insets, 10 μm. n = 17. All data represent the means ± SD of independent biological replicates. [(A) to (D)] *P < 0.05, **P < 0.01, ****P < 0.0001, unpaired Student’s t test; [(E) and (F)] *P < 0.05, **P < 0.01, ***P < 0.001, ****P < 0.0001, one-way ANOVA with Tukey’s multiple comparison test; [(G) to (J)] **P < 0.01, paired t test; ns, not significant.
Fig. 2.
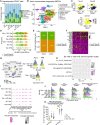
Fig. 2.. DMNQ-induced mitochondrial stress enhances chromatin accessibility at STAT5 target genes.
(A and B) Quantification of mitochondrial (A) and cellular ROS (B) in naïve (M0) and DMNQ-differentiated hMDMs, assessed by flow cytometry. (C) Filopodium quantification via Phalloidin Red staining in hMDMs treated as in (A). The right panel shows a representative image with arrows highlighting filopodia. Scale bar and insert, 10 μm. (D) Migration assay in hMDMs differentiated as in (A). Data represent the percentage of migrated cells normalized to nonmigrated cells, expressed as a fold of M0 macrophages. (E) Phagocytosis assay using pHrodo Zymosan particles in hMDMs differentiated as in (A), shown as the MFI. All data represent the means ± SD of independent biological replicates. n ≥ 4. *P < 0.05, **P < 0.01, unpaired Student’s t test. (F) MA plot of differentially accessible peaks from bulk ATAC-seq comparing normalized counts of naïve (M0) hMDMs and DMNQ-differentiated hMDMs. Purple points indicate significant peaks [−1 < log2FC (fold change) > 1; FDR < 0.05]. (G) Summary profile plots and heatmap of chromatin accessibility generated by using normalized read coverages around TSSs (−2 to +2 kb) from merged replicates (n = 4). Colored tracks represent genes with increased accessibility after DMNQ treatment. kbp, kilo–base pairs; bp, base pairs. (H) Dot plot of enriched HALLMARK_PATHWAY terms from genes in (G), ranked by P value. Significant terms (P ≤ 0.05) are highlighted. (I) Summary profile plots and heatmap of chromatin accessibility around the TSS (−2 to +2 kb) from snATAC-seq of human atherosclerotic lesions, comparing lipid-associated macrophages (pink) and resident macrophages (light blue). Colored tracks represent STAT5 target genes with increased accessibility after DMNQ treatment. (J) Heatmap of top DMNQ–positively regulated STAT5 target genes from scRNA-seq of human atherosclerotic lesions, comparing lipid-associated macrophages (pink) and resident macrophages (light blue). Data are tag counts per million.
Fig. 3.
Fig. 3.. Mitochondrial superoxide drives pYSTAT5-dependent foam cell formation.
(A) pYSTAT5 levels in naïve (M0) and LPS + IFN-γ–polarized hMDMs with or without DMNQ, assessed by flow cytometry. n = 7. (B) pYSTAT5 quantification in oxLDL-treated hMDMs (24 hours) ± S5i or mTEMPO pretreatment (both 1 hour). n = 4. (C) Mitochondrial superoxide (O2•−) production in oxLDL-treated hMDMs (24 hours) ± S5i, determined by flow cytometry. n = 5. (D) Mitochondrial membrane potential (ΔΨm) assessment by flow cytometry in oxLDL-treated hMDMs (24 hours) ± S5i, mTEMPO (both 1 hour), or MitoQ (2 hours) pretreatment. Cells stained with TMRM and MTG and data shown as a ratio of TMRM+ cells to MTG+ cells (%). n = 5. (E) CD36 expression and representative flow cytometry histogram in hMDMs treated as in (B). n = 4. (F) Oil Red O staining in hMDMs treated as in (C). Lipids in red; nuclei in blue. The right panel shows a representative image and a zoomed-in inset. Arrows indicate lipid-positive cells. Scale bar, 50 μm; inset, 20 μm. n = 5. (G) Migration assay in oxLDL-treated mouse BMDMs from Stat5-deficient mice [Vav1-Cre/+Stat5abfl/fl (Stat5−/−) mice] and their wild-type counterpart (Stat5fl/fl) ± mTEMPO or both. Data represent the migrated area, normalized to nonmigrated cells (%). n = 5. (H) Phagocytosis of pHrodo-labeled Escherichia coli particles in BMDMs treated as in (F), shown as % positive cells normalized to unstimulated controls, with representative histograms. n = 4. All data represent the means ± SD of independent biological replicates. (A) *P < 0.05, paired t test; [(B) to (F)] *P < 0.05, **P < 0.01, one-way ANOVA with Tukey’s multiple comparison test; [(G) and (H)] *P < 0.05, **P < 0.01, ***P < 0.001, two-way ANOVA with Tukey’s test (intragroup) and Sidak’s test (intergroup).
Fig. 4.
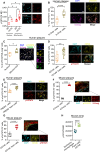
Fig. 4.. MitoROS-induced pYSTAT5 is highly expressed in human and mouse foam cells.
(A) Quantification of nuclear and mitochondrial pYSTAT5 MFI in hMDMs treated with oxLDL for 24 hours. Mitochondria identified by VDAC1/Porin+ signals; nuclei by DAPI+ signals. Representative image scale bar, 20 μm. n = 5. (B) Quantification and representative image of mitochondrial pYSTAT5 in human carotid plaques, comparing 8-oxog+ cells to remaining plaque cells. Scale bar, 50 μm. n = 10. (C) Nuclear and mitochondrial pYSTAT5 quantification in 8-oxog+ cells within human carotid plaques. Arrows highlight pYSTAT5+ 8-oxog+ cells in mitochondria (identified by TOM22+ signals). Scale bar, 50 μm; inset, 10 μm. n = 10. (D and E) Mitochondrial pYSTAT5 quantification in CD146+ (D) and TREM2+ (E) cells versus other plaque cells. Arrows highlight pYSTAT5+ foam cells. Scale bars, 10 μm. n = 19 (D) and n = 15 (E). (F and G) Relative nuclear and mitochondrial pYSTAT5 localization in mouse aortic plaques from ApoE−/− mice (HFD, 16 weeks), comparing 8-oxog+ versus 8-oxog cells (F) and CD146+ foam versus CD146 cells (G). Each dot, one mouse. Scale bars, 20 μm; insets, 10 μm. n = 11 (G) and n = 9 (H). (H) pYSTAT5 levels in CD45+ Ly6g Cd11b+ F4/80+ CD146 nonfoamy macrophages versus CD45+ Ly6g Cd11b+ F4/80+ CD146+ foam cells from ApoE−/− mouse aortas (HFD, 16 weeks). Each dot, one mouse. n = 5. All data represent the means ± SD of independent biological replicates. (A) *P < 0.05, two-way ANOVA with Tukey’s test (intragroup) and Sidak’s test (intergroup). [(B) to (G)] *P < 0.05, **P < 0.01, ****P < 0.0001, paired t test. (H) ****P < 0.0001, unpaired Student’s t test.
Fig. 5.
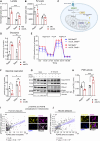
Fig. 5.. STAT5 deficiency improves the mitochondrial function.
(A and B) Lactate and pyruvate metabolite levels in BMDMs from Stat5-deficient mice [Vav1-Cre/+Stat5abfl/fl (Stat5−/−) mice] and their wild-type counterpart (Stat5fl/fl), following 24-hour oxLDL stimulation, measured by liquid chromatography–mass spectrometry (LC-MS) and normalized to internal amino acid standards. (C) Schematic overview of examined metabolic pathways. Glucose uptake initiates glycolysis, producing pyruvate, which is either converted into lactate or acetyl-CoA, fueling the TCA cycle, leading to ATP production through OXPHOS and FAO. Created in BioRender. Hohensinner, P. (2025). https://biorender.com/ckfllob. (D) Glycolytic activity in oxLDL-treated BMDMs (24 hours) assessed by the ECAR, measured by Seahorse XF Glycolysis stress test. (E) OCR assessment in BMDMs treated as in (D) by the Seahorse XF mito stress test. (F) Quantification of maximal respiration based on the data in (E). (G) Coimmunoprecipitation of STAT5 with PDC-E2, PDHA1, and PDHB in BMDMs differentiated for 7 days with DMNQ and polarized with LPS + IFN-γ ± DMNQ (24 hours). The Western blot shows immunoprecipitated proteins and 20% input, with vinculin as loading control. n = 3. IP, immunoprecipitation; kDa, kilodalton. (H) PDH enzyme activity in BMDMS treated as in (D), presented as the rate of enzymatic activity. (I and J) Scatter plot of pYSTAT5-PDHB colocalization in human carotid plaques (n = 18) (I) and mouse aortic plaques (n = 10; ApoE−/− mice, HFD, 16 weeks) (J). The red line shows regression with standard error. Representative images scale bars, 10 μm. Pearson correlation assessed by Student’s t test. r, Pearson’s correlation coefficient. All data represent the means ± SD of independent biological replicates. Each dot, one mouse. [(A), (B), (D), (F), (H)] *P < 0.05, **P < 0.01, ***P < 0.001, two-way ANOVA with Tukey’s test (intragroup) and Sidak’s test (intergroup). n = 3.
Fig. 6.
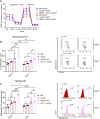
Fig. 6.. oxLDL-induced STAT5 drives mitochondrial superoxide production via complex III.
(A) OCR, as readouts for OXPHOS, measured by the Seahorse XF mito stress test in BMDMs isolated from Stat5-deficient mice [Vav1-Cre/+Stat5abfl/fl (Stat5−/−) mice] and their wild-type counterpart (Stat5fl/fl). Cells were treated with oxLDL for 24 ± 3–hour pretreatment using DMM. (B and C) Mitochondrial superoxide (O2•−) production assessed by flow cytometry using either MitoSOX red staining (B) or MitoNeoD staining, followed by quantification of its oxidized product MitoNeoOH (C). BMDMs were treated with oxLDL for 24 hours ± oligomycin in the last 30 min of oxLDL stimulation or for 30 min in M0 macrophage controls. Right panels display representative flow cytometry histograms. All data represent the means ± SD of independent biological replicates. Each dot, one mouse. *P < 0.05, **P < 0.01, ***P < 0.001, ****P < 0.0001, two-way ANOVA with Tukey’s test (intragroup) and Sidak’s test (intergroup). n = 3.
Fig. 7.
Fig. 7.. STAT5 inhibition limits the accumulation of mitoROS-stressed foam cells in advanced atherosclerosis.
(A) Quantification and representative images of mitochondrial pYSTAT5 localization in CD146+ foam cells from mouse aortic plaques of ApoE−/− mice fed with an HFD for 4, 10, and 16 weeks. Scale bar, 50 μm. n = 5 (4 weeks), n = 4 (10 weeks), and n = 11 (16 weeks). (B) pYSTAT5 staining in total aortic cells from ApoE−/− mice fed with an HFD for 4, 10, or 16 weeks, with an HFD for a total of 16 weeks with or without persistent S5i administration or starting after 4 weeks, or with DMSO control, measured by flow cytometry. n = 5. (C) Plasma cholesterol and LDL levels in ApoE−/− mice fed and treated as in (B) compared to chow-fed controls (15 and 25 weeks old). n = 6 (D) H&E staining of liver tissue from mice fed and treated as in (B). Data are given as the area covered by fat droplets normalized to the total liver area. Representative images are shown. Scale bars, 20 μm. n = 6. (E) Quantification of TREM2 protein levels in CD45+ Ly6g Cd11b+ F4/80+ TREM2+ aortic cells from ApoE−/− mice fed and treated as in (B). n = 5. (F) Quantification of mitochondrial 8-oxog in TREM2+ foam cells from aortic plaques of ApoE−/− mice fed and treated as in (C). Representative images shown for 16 weeks and S5i 16-week groups. Scale bars, 10 μm. n = 6. All data represent the means ± SD of independent biological replicates. Each dot, one mouse. *P < 0.05, **P < 0.01, ***P < 0.001, ****P < 0.0001, one-way ANOVA with Tukey’s test.
Fig. 8.
Fig. 8.. STAT5 inhibition delays the transition from early Trem2hiSlamf9hi to end-stage Trem2hiGpnmbhi foam cells.
(A) DittoBarPlot showing CD45+ hematopoietic cells (%) from scRNA-seq of aortic cells in ApoE−/− mice fed with HFD for 4, 10, and 16 weeks ± S5i treatment (see fig. S6A). Six mice pooled per library. (B) t-SNE visualization of aortic MPCs after subsetting and reclustering macrophage and APC/monocyte clusters. (C) t-SNE FeaturePlots showing Trem2, Gpnmb, and Slamf9 expression in MPCs. (D) Slingshot trajectory analysis of Trem2hiSlamf9hi and Trem2hiGpnmbhi clusters from 10-weeks and 16-week HFD datasets ± S5i. x axis, slingshot pseudotime. (E) Percentage of cells expressing Stat5a and Stat5b in both foam cell clusters from (D). (F) Heatmap of DMNQ–positively regulated STAT5 target genes (from Fig. 2G) in the same clusters as in (D), displayed as a log2 fold change. (G) Circular bar plot of 15 STAT5 target genes from (F) expressed in Trem2hiGpnmbhi cells from ApoE−/− mice treated with S5i (continuous or from 4 weeks) versus HFD controls. Right: RidgePlot of three representative genes. (H) Dot plot representation of enriched HALLMARK_PATHWAY terms for S5i–down-regulated genes (16 weeks of HFD versus DMSO) in Trem2hiGpnmbhi cells. Dot size, transcript numbers. (I) Dot plot showing the expression of representative genes involved in glycolysis, TCA cycle, FAO, and mitochondrial stress response in Trem2hiGpnmbhi cells. Dot size, average expression. The color indicates expressing cells (%). (J) RidgePlot of Slc2a1 (glycolysis), Acads (TCA cycle), Aco2 (FAO), and mitochondrial stress response (Pink1) from (I). (K) Quantification of mitochondrial 8-oxog in Trem2hiGpnmbhi cells from aortic plaques of ApoE−/− mice fed with an HFD for 16 weeks ± S5i (continuous or from 4 weeks). Data are the means ± SD of independent biological replicates. *P < 0.05, two-way ANOVA with Tukey’s test (intragroup). n = 6. Each dot, one mouse.
Fig. 9.
Fig. 9.. Working model of oxLDL-induced metabolic reprogramming in foam cells.
oxLDL triggers mitochondrial oxidative stress in macrophages through a STAT5-dependent pathway that promotes foam cell formation (lipid-laden foam cell phenotype). Within mitochondria, oxLDL reduces the mitochondrial membrane potential (ΔΨm) and stimulates the production of mitochondrial superoxide (O2•−), which subsequently activates STAT5. Once activated, STAT5 interacts with the PDC, thereby contributing to reduction of PDC activity. This metabolic blockade decreases the OCR, stalling the ETC. Consequently, complex III amplifies mitochondrial O2•− production, creating a self-reinforcing feedback loop. In parallel, oxLDL promotes glycolysis through a mechanism that is largely STAT5-independent. In the absence of STAT5 (macrophage phenotype), mitochondrial respiration is increased already at the baseline, with partially preserved oxidative metabolism upon oxLDL exposure. This is accompanied by reduced mitochondrial O2•− production and increased PDC activity. As a result, mitochondrial respiration and ETC activity are elevated, while mitochondrial O2•− generation is reduced. However, even in the absence of STAT5, oxLDL treatment continues to enhance glycolysis, impair mitochondrial respiration, and disrupt redox homeostasis. Overall, STAT5 mediates oxLDL-induced mitochondrial dysfunction, oxidative stress, and foam cell formation in macrophages. Although STAT5 loss partially restores the mitochondrial function, oxLDL-induced glycolysis and mitochondrial impairment persist, highlighting additional STAT5-independent pathways. Created in BioRender. Hohensinner, P. (2025). https://biorender.com/jx9oiyv.

References

    1. Batty M., Bennett M. R., Yu E., The role of oxidative stress in atherosclerosis. Cells 11, 3843 (2022). - PMC - PubMed
    1. Patial S., Sharma A., Raj K., Shukla G., Atherosclerosis: Progression, risk factors, diagnosis, treatment, probiotics and synbiotics as a new prophylactic hope. Microbe 5, 100212 (2024).
    1. Hou P., Fang J., Liu Z., Shi Y., Agostini M., Bernassola F., Bove P., Candi E., Rovella V., Sica G., Sun Q., Wang Y., Scimeca M., Federici M., Mauriello A., Melino G., Macrophage polarization and metabolism in atherosclerosis. Cell Death Dis. 14, 691 (2023). - PMC - PubMed
    1. Wang J., Wu Q., Wang X., Liu H., Chen M., Xu L., Zhang Z., Li K., Li W., Zhong J., Targeting macrophage phenotypes and metabolism as novel therapeutic approaches in atherosclerosis and related cardiovascular diseases. Curr. Atheroscler. Rep. 26, 573–588 (2024). - PMC - PubMed
    1. Li M., Wang Z. W., Fang L. J., Cheng S. Q., Wang X., Liu N. F., Programmed cell death in atherosclerosis and vascular calcification. Cell Death Dis. 13, 467 (2022). - PMC - PubMed