. 2025 Aug 29;11(35):eadw1059.
doi: 10.1126/sciadv.adw1059. Epub 2025 Aug 27.

ACTN3 genotype influences androgen response in developing murine skeletal muscle

Affiliations

ACTN3 genotype influences androgen response in developing murine skeletal muscle

Kelly N Roeszler et al. Sci Adv. .

Abstract

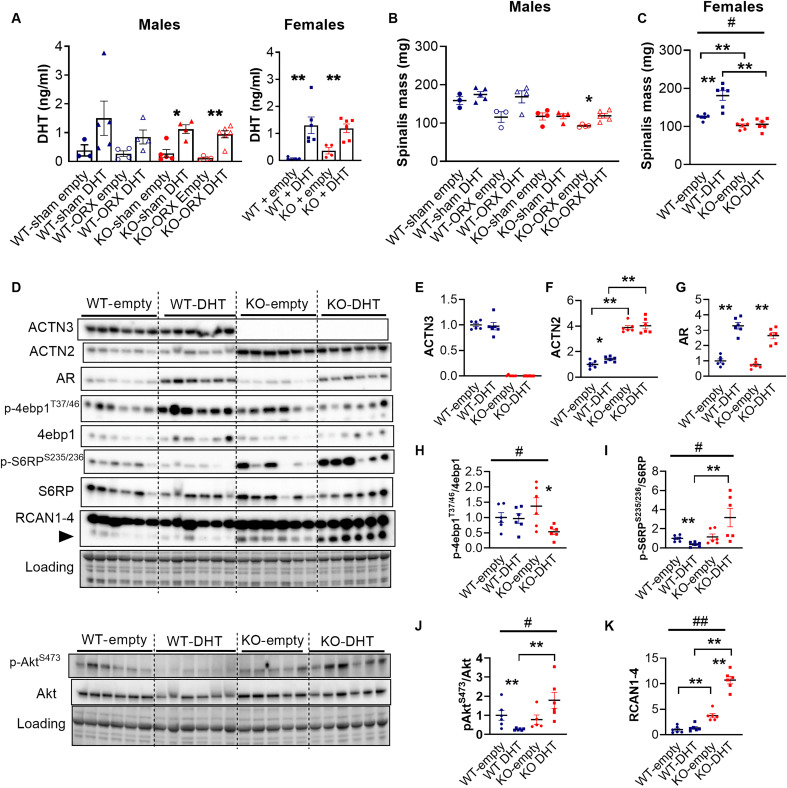
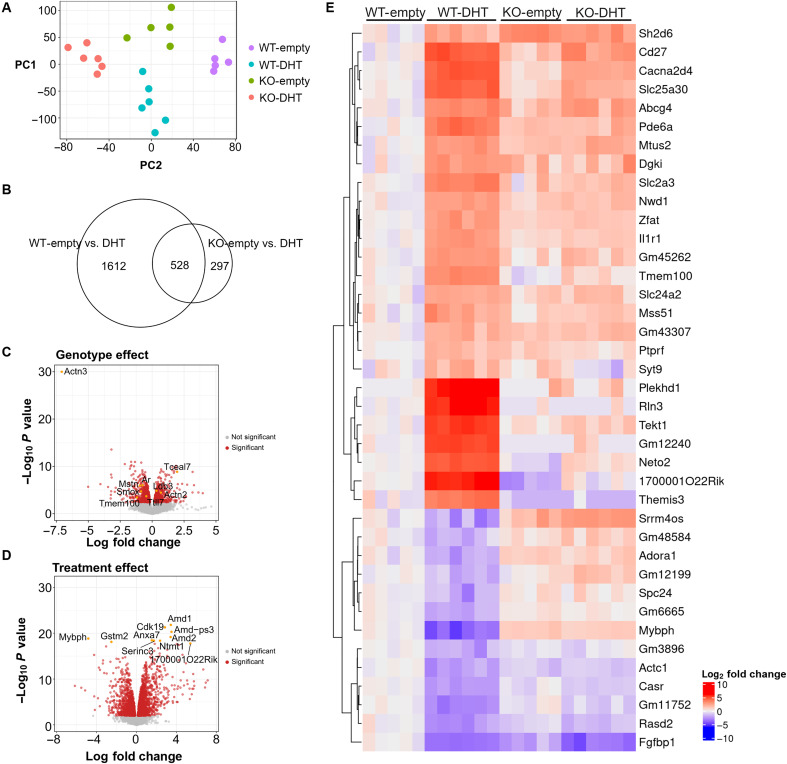
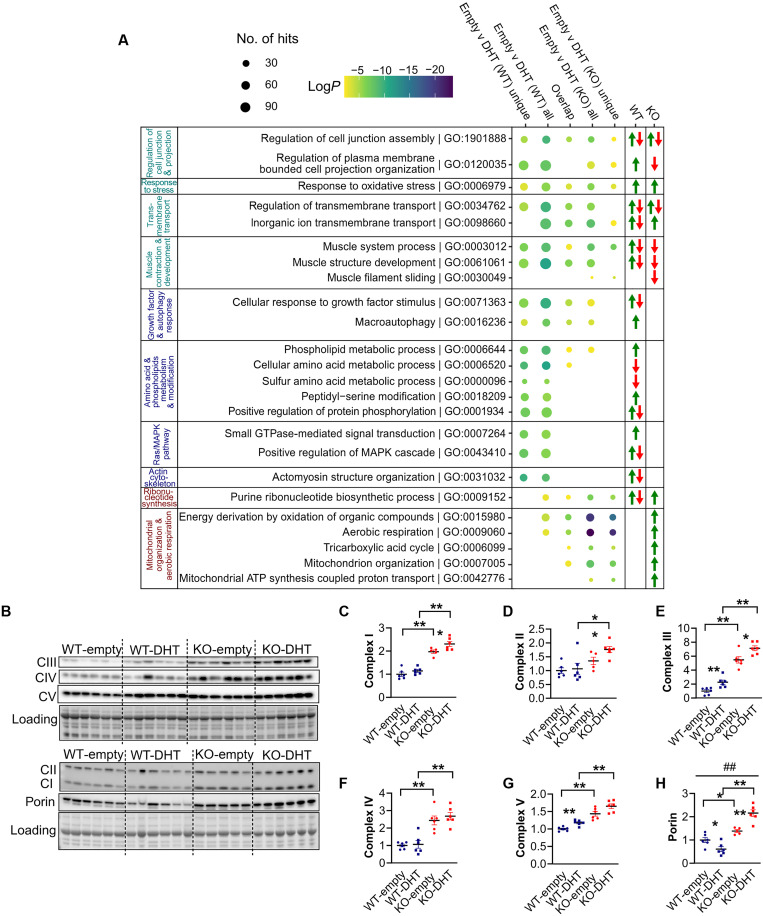
Androgens act through androgen receptor (AR) to maintain muscle mass. Evidence suggests that this pathway is influenced by "the gene for speed," ACTN3 (α-actinin-3). Given that one in five people lack α-actinin-3, it is possible that they may respond to androgens differently. Here, we show that α-actinin-3 deficiency decreases AR in muscles of mice and humans (in males and females) and that AR positively correlates with α-actinin-3 expression in a dosage-dependent manner. α-Actinin-3 deficiency exacerbates gastrocnemius mass loss with androgen deprivation in male mice and stunts the muscle growth response to dihydrotestosterone in female mice at the onset of puberty. This is mediated by differential activation of pathways regulating amino acid metabolism, intracellular transport, autophagy, mitochondrial activity, MAPK, and calcineurin signaling, likely driven by seven key genes that are both androgen sensitive and α-actinin-3-dependent in expression. Our results highlight a role for ACTN3 as a regulator of muscle mass and a genetic modifier of androgen action in skeletal muscle.


Figures

Fig. 1.
Fig. 1.. AR protein expression is reduced with α-actinin-3 deficiency in skeletal muscle and testis.
(A) Trans-eQTL scan in the GTEx skeletal muscle dataset show that the R577X variant is significantly associated with ACTN3 gene expression, but not for ACTN2 or AR. (B) Protein expression of AR is significantly reduced in muscles from 577XX individuals compared to those from 577RR in males and females. (C) Expression of Ar and Ar-responsive genes (Odc1 and Smox) is lower in Actn3 KO muscles relative to that in WT in male, but not female, mice. (D) AR protein expression is lower in gastrocnemius muscles from male and female Actn3 KO mice compared to those from WT. (E) Delivery of rAAV-CMV-ACTN3 (5 × 10⁸ to 5 × 10¹⁰ vg) in Actn3 KO muscles increased α-actinin-3 expression up to 1 × 10¹⁰ vg and decreased α-actinin-2, while AR expression is positively correlated with vector dosage. (F) Immunohistochemistry show absence of ACTN3 in KO testes and reduced AR staining compared to that in WT; reduced AR expression in KO testis is quantified by Western blot. (G) Testis mass is greater in KO mice compared to that in WT, but seminal vesicle mass and serum testosterone, as measured by radioimmunoassay assay (males) and mass spectrometry (females), are not different between Actn3 genotypes. Data are represented as means ± SEM. *P < 0.05 and **P < 0.01 by Mann-Whitney U test; #P < 0.05 by two-way analysis of variance (ANOVA).
Fig. 2.
Fig. 2.. α-Actinin-3 deficiency differentially alters the muscle wasting and calcineurin signaling response induced by androgen deprivation.
Orchidectomy (ORX) decreased (A) body mass, (B) seminal vesicle, (C) levator ani bulbocavernosus (LABC), and (D) gastrocnemius mass of WT and Actn3 KO mice; KO showed greater atrophy for the gastrocnemius muscle compared to WT. (E) The size of fast 2B, 2X, and 2A fibers is reduced in KO-ORX, but not WT-ORX, gastrocnemius muscles compared to that in controls. (F) Muscles of orchidectomized WT, but not KO, show significant reductions in fiber count. (G) Western blot analyses quantify the effect of ORX in WT and KO gastrocnemius muscles on the expression of (H) ACTN3, (I) ACTN2, (J) AR, (K) p-4ebp1Thr37/46/4ebp1, (L) p-S6RPSer235/236/S6RP, and (M) RCAN1-4. Data are represented as means ± SEM. *P < 0.05, **P < 0.01, ***P < 0.001, and ****P < 0.0001 by Mann-Whitney U test; #P < 0.05 by two-way ANOVA.
Fig. 3.
Fig. 3.. Transcriptomic analysis highlights the differential metabolic response to androgen deprivation with α-actinin-3 deficiency.
(A) Principal components analysis (PCA) dot plot shows clear separation and grouping of samples by treatment (sham/ORX) on principal component 1 (PC1) and Actn3 genotype (WT/KO) on PC2. (B) Venn diagram (q < 0.01) shows a comparable number of differentially expressed genes for WT and KO in response to ORX, along with 492 genes that overlap for their effect in both genotypes compared to ORX. (C and D) Volcano plots highlight the differentially expressed genes (q ≤ 0.01, in red) due to the effect of (C) Actn3 genotype and (D) ORX. (E) Heatmap shows expression in log2 fold change of the 14 statistically significant genes (q < 0.05) from the interaction test performed. Fold changes are calculated against the mean of WT-sham expression samples. (F) Summarized gene set enrichment analysis groups GO terms by commonality and illustrates the difference in response to ORX between WT (WT unique, in blue) and Actn3 KO (KO unique, in red) along with those that are present in both genotypes (in teal). The size of the circles represents the number of hits within the GO term and statistical significance in log(P) is represented by the color of the circle. Green and red arrows denote increased and decreased expression, respectively, of genes enriched in each GO term in ORX samples relative to that in sham. CoA, coenzyme A. (G) Western blot analysis confirms differential Actn3 genotype effects on the response to ORX for (H) autophagy marker p62 and (I) LC3 lipidation, as well as changes for (J) porin and (K to O) mitochondrial complexes I to V. Data are represented as means ± SEM; *P < 0.05 and **P < 0.01 by Mann-Whitney U test; #P < 0.05 by two-way ANOVA.
Fig. 4.
Fig. 4.. α-Actinin-3 deficiency decreases the muscle growth response to DHT at the onset of puberty.
(A) Liquid chromatography–mass spectrometry (LC-MS) confirms increases in serum DHT in male (sham/ORX) and female WT and Actn3 KO mice that were implanted with silastic tubing containing 10 mg of crystalline DHT for 6 weeks, relative to that in mice that were implanted with empty tubing. (B) DHT treatment prevented atrophy of spinalis muscles in orchidectomized WT and KO mice (C) Female WT-DHT, but not KO-DHT, mice show increases in spinalis mass relative to empty controls. (D) Western blot analysis quantifies the effect of DHT in female WT and KO spinalis muscles on the expression of (E) ACTN3, (F) ACTN2, (G) AR, (H) p-4ebp1Thr37/46/4ebp1, (I) p-S6RPSer235/236/S6RP, (J) p-AktSer473/Akt, and (K) RCAN1-4. Data are represented as means ± SEM; *P < 0.05 and **P < 0.01 by Mann-Whitney U test; #P < 0.05 and ##P < 0.0001 by two-way ANOVA.
Fig. 5.
Fig. 5.. α-Actinin-3–deficient muscles show fewer differentially expressed genes in response to DHT.
(A) PCA plot shows clear separation and grouping of samples by Actn3 genotype (WT/KO) and treatment (empty/DHT) in two dimensions. (B) Venn diagrams (q < 0.01) illustrate greater differential gene expression for WT (1612 unique genes) in response to DHT compared to KO (297 unique genes), along with 528 genes that have an overlap of effect in both genotypes. (C and D) Volcano plots highlight the differentially expressed genes (q ≤ 0.01, in red) due to the effects of (C) Actn3 genotype and (D) DHT. (E) Heatmap shows the log2 fold change of genes that are statistically significant from the interaction between Actn3 genotype and DHT treatment (q ≤ 0.01, log2 fold change ≥ 2). Fold changes are calculated against the mean of WT-empty expression samples.
Fig. 6.
Fig. 6.. α-Actinin-3 deficiency alters the muscle transcriptomic response to DHT with preferential activation of mitochondrial metabolic processes.
(A) Gene set enrichment analysis was performed to compare the difference in DHT response between WT (WT unique) and Actn3 KO (KO unique) along with those representing commonality. A representative list of the top GO terms for each contrast is shown. Groups in teal are common in WT and KO, groups in blue denote GO terms with unique enrichment in WT, while groups in red show further unique enrichment in KO. Green and red arrows denote increased and decreased expression, respectively, of genes enriched in each GO term in DHT samples relative to that in empty. GTPase, guanosine triphosphatase. (B) Western blot analysis confirms differential Actn3 genotype effects on the response to DHT for mitochondrial complexes I to V (C to G) and (H) porin. Data are represented as means ± SEM; *P < 0.05 and **P < 0.01 by Mann-Whitney U test; ##P < 0.0001 by two-way ANOVA.
Fig. 7.
Fig. 7.. α-Actinin-3–dependent mediators of androgen response in skeletal muscle.
(A) Log2 fold change (Log2FC) of differentially expressed genes (DEGs) that show significant interactions between ORX and Actn3 genotype and also between DHT treatment and Actn3 genotype. The DHT and ORX fold change responses for these DEGs are inverse. For both experiments, gene expression changes are lower in Actn3 KO samples. (B) Schematic of proposed mechanistic changes with α-actinin-3 deficiency in response to androgen deprivation and DHT treatment. The absence of α-actinin-3 (which results in reduced muscle AR) inhibits/dampens the transcriptional response of Mybph, Itpr1, Ampd1, Syne1, Ttll7, Pitpna, and Spns2 to changes in circulating androgens. The putative functions of these genes relate to autophagy, calcium homeostasis, purine nucleotide metabolism, nucleus-actin cytoskeleton organization, neurite growth, phosphatidylinositol signaling, and sphingosine-1 phosphate transport, respectively. The altered response of these genes to androgen deprivation and DHT treatment with α-actinin-3 deficiency may contribute to many of the differential downstream signaling [e.g., calcineurin, MAPK, phosphatidylinositol 3-kinase (PI3K)/Akt/mTORC1, autophagy, and oxidative metabolism] that influence muscle mass. The gene 2310016D23Rik is also differentially expressed but is excluded from the schematic because its function is unknown. Created with BioRender.com. Seto, J. (2025) https://BioRender.com/0dv2hot.

References

    1. Handelsman D. J., Androgen misuse and abuse. Endocr. Rev. 42, 457–501 (2021). - PubMed
    1. Huang G., Bhasin S., Pencina K., Cheng M., Jasuja R., Circulating dihydrotestosterone, testosterone, and free testosterone levels and dihydrotestosterone-to-testosterone ratios in healthy women across the menstrual cycle. Fertil. Steril. 118, 1150–1158 (2022). - PubMed
    1. de Rooy C., Grossmann M., Zajac J. D., Cheung A. S., Targeting muscle signaling pathways to minimize adverse effects of androgen deprivation. Endocr. Relat. Cancer 23, R15–R26 (2016). - PubMed
    1. Basualto-Alarcon C., Varela D., Duran J., Maass R., Estrada M., Sarcopenia and androgens: A link between pathology and treatment. Front. Endocrinol. (Lausanne) 5, 217 (2014). - PMC - PubMed
    1. Qin W., Pan J., Wu Y., Bauman W. A., Cardozo C., Anabolic steroids activate calcineurin-NFAT signaling and thereby increase myotube size and reduce denervation atrophy. Mol. Cell. Endocrinol. 399, 336–345 (2015). - PubMed