. 2025 Aug 29;11(35):eadv5019.
doi: 10.1126/sciadv.adv5019. Epub 2025 Aug 27.

Annotation-free discovery of disease-relevant cells in single-cell datasets

Affiliations

Annotation-free discovery of disease-relevant cells in single-cell datasets

Erin Craig et al. Sci Adv. .

Abstract

In single-cell datasets, patient labels indicating disease status (e.g., "sick" or "not sick") are typically available, but individual cell labels indicating which of a patient's cells are associated with their disease state are generally unknown. To address this, we introduce mixture modeling for multiple-instance learning (MMIL), an expectation-maximization approach that trains cell-level binary classifiers using only patient-level labels. Applied to primary samples from patients with acute leukemia, MMIL accurately separates leukemia from nonleukemia baseline cells, including rare minimal residual disease (MRD) cells; generalizes across tissues and treatment time points; and identifies biologically relevant features with accuracy approaching that of a hematopathologist. MMIL can also incorporate cell labels when they are available, creating a robust framework for leveraging both labeled and unlabeled cells. MMIL provides a flexible modeling framework for cell classification, especially in scenarios with unknown gold-standard cell labels.


Figures
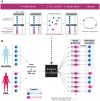
Fig. 1.
Fig. 1.. Mixture modeling for multiple-instance learning.
(A) Process to train a mixture model for multiple instance learning (MMIL). We initialize the patient’s cell labels as 0.5: In this example, we assume that the prevalence of disease-associated cells in patients (ρ) is 50%, so each cell is initially given a 50/50 chance of being disease associated. After training the first classifier, we improve our estimates of the patient’s cell labels. This process is repeated until convergence. (B) Schematic of model training and evaluation on the AML cohorts from (13) and (20).
Algorithm 1.
Algorithm 1.. Mixture modeling for multiple-instance learning (MMIL) is a method to learn cell labels using patient labels.
Our dataset consists of cells with labels indicating whether they were sampled from patients or healthy donors. We assume that cells from healthy people are not disease associated: This assumption allows us to train a model that uses these cells to characterize the “baseline” class. The model can then tease out the “disease-associated” class by finding cells from patients that are distinct from the baseline class. This approach is an application of the expectation-maximization (EM) algorithm.
Algorithm 2.
Algorithm 2.. Train a mixture model for multiple instance learning data.
Fig. 2.
Fig. 2.. MMIL detects cancer cells in AML using patient labels only.
(A) Receiver operating characteristic (ROC) curves demonstrating individual (thin) and average (thick) performance of oracle, MMIL, and naive models trained to detect leukemic blasts in AML CyTOF dataset. Insets indicate mean area under the ROC curve (AUC) across all patients. (B) Scatterplots representing the relationship between the gold-standard, pathologist-enumerated blast percentage for each patient (x axis) and the model-assigned blast percentage for each patient for the oracle (red), MMIL (blue), and naive (yellow) lasso models. Inset text represents the Pearson correlation coefficients between the values on the x and y axes. (C) ROC curves demonstrating individual (thin) and average (thick) performance of oracle, MMIL, and naive models trained to detect leukemic blasts in AML scRNA-seq dataset. Insets indicate mean AUC across all patients.
Fig. 3.
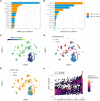
Fig. 3.. MMIL identifies regions of high-dimensional phenotype space containing cells from patients with AML, but not healthy controls.
(A) Nonzero coefficients for the MMIL model trained to detect leukemic blasts in AML. (B) Nonzero coefficients for the “oracle” lasso model trained to detect leukemic blasts in AML. (C) A scatterplot of uniform manifold approximation and projection (UMAP) coordinates colored by MMIL probabilities. Cells with scores of 0 have a small chance of being AML-associated (i.e., leukemic blasts), whereas cells with probability scores near 1 have a high chance of being AML-associated. (D) UMAP plot as in (C), but with cells labeled as leukemic blasts in red and cells annotated as baseline cells by a pathologist in blue. Note the general agreement of probabilities in (C) to red regions in (D). (E) UMAP plot as in (C), but with cells from patients with cancer shown in orange and cells from healthy controls in blue. Note that regions with overlapping orange and blue cells are assigned low MMIL probabilities in (C). (F) Count heatmap of two-dimensional bins demonstrating the correlation between the average MMIL probability in a phenotypic neighborhood (y axis) and the proportion of cells from patients with cancer it contains (x axis). Bins are colored by the density of neighborhoods in that region, and the red line represents the locally weighted moving average across the x axis. Inset text indicates the Spearman correlation between the values on the x and y axes. In (A) to (E), UMAP coordinates were calculated using all protein markers.
Fig. 4.
Fig. 4.. MMIL can train on labeled and unlabeled data simultaneously to incorporate expert knowledge while remaining robust to imperfect labeling.
(A) Schematic of semisupervised 0-shot and 1-shot MMIL experiments (also see Materials and Methods). (B) Boxplots indicating average AUROC for MMIL (blue), naive (orange), and oracle (red) models across 0-shot (left), 1-shot (with perfect labels; middle), and 1-shot (with imperfect labels; right) training procedures. ***P < 0.0001 using a paired Student’s t test with Benjamini-Hochberg correction for multiple comparisons. (C) Positive lasso coefficients for an oracle model fit on a single patient (AML-5An). (D) Positive MMIL coefficients after 0-shot (left) and 1-shot (right) learning. Note that rRNA, the feature with the largest oracle lasso coefficient in (C) and Fig. 3B, was selected with a positive coefficient only after 1-shot learning. (E) Two-sided bar plot indicating how many times a feature was included in the MMIL model with a positive coefficient after 0-shot (left, blue) and 1-shot (right, orange) training. Dashed gray lines indicate the maximum number of times a feature could have been included (13, the total number of 1-shot experiments).
Fig. 5.
Fig. 5.. MMIL identifies leukemia cells across distinct tissues and treatment time points in pediatric ALL without training on known cell labels.
We compare the performance of MMIL to the oracle model (trained using gold-standard labels) and the naive model (trained using patient labels in place of cell labels). After training on diagnostic bone marrow specimens (A), MMIL generalizes to different tissues and treatment time points better than the naive model, evidenced by its performance on blood samples collected at (B) diagnosis, (C) day 8 posttreatment initiation, and (D) day 15 posttreatment initiation. Note that the oracle model is provided as a reference for the highest achievable classifier performance, as it is trained on gold-standard labels that are typically unknown.
Fig. 6.
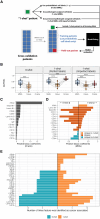
Fig. 6.. MMIL prospectively identifies cells that predict MRD at diagnosis and that expand in paired relapse samples.
(A) Comparison of patient-level AUROCs across methods: FlowSOM, PhenoGraph, pseudobulk, and MMIL (mean, median, quantile, and threshold; see Materials and Methods) using cross-validation to separate MRD-positive and MRD-negative patients at the diagnostic time point. Each point is the AUROC for a fold of fivefold cross-validation. MMIL consistently outperforms other methods in classification performance. (B) Comparison of MMIL-assigned patient-level probabilities across MRD-positive and MRD-negative patients in the diagnostic cohort, showing MMIL’s ability to separate groups. Probabilities were calculated in the held-out fold. (C) Heatmap showing mean expression of the 15 features with the largest lasso coefficients in the MMIL model across diagnostic samples. Mean expression values were calculated from cells with MMIL probabilities at or above the ρth quantile (99th percentile) in each patient’s diagnostic samples, where ρ is the parameter used to train the MMIL model. Dendrograms (sample-wise hierarchical clustering) are shown at left, and sample annotations are shown at right. Features are ordered by lasso coefficient (bar plot). TdT, terminal deoxynucleotidyl transferase. (D) UMAP projection of paired relapse samples from a single patient with ALL (UPN10), showing expansion of high-probability MMIL phenotypes at relapse. Also see fig. S13. (E) Minimum-spanning tree (MST) visualization of FlowSOM clustering results for diagnostic and relapse samples from patient UPN10 demonstrating expansion of high MMIL-probability clusters. Clusters are annotated as MMIL-high and MMIL-low based on MMIL probability scores of the cells they contain (Materials and Methods). Also see fig. S13. (F) Quantification of the relative abundance of high MMIL-probability cells in relapse samples versus diagnostic samples across all five patients with diagnosis-relapse sample pairs, demonstrating significant increase at relapse. *P < 0.05 for a paired t test between the relapse and diagnostic time points (t4 = 5.27; P = 0.006).

References

    1. Gulati G. S., D’Silva J. P., Liu Y., Wang L., Newman A. M., Profiling cell identity and tissue architecture with single-cell and spatial transcriptomics. Nat. Rev. Mol. Cell Biol. 26, 11–31 (2025). - PubMed
    1. Hanahan D., Hallmarks of cancer: New dimensions. Cancer Discov. 12, 31–46 (2022). - PubMed
    1. Pisetsky D. S., Pathogenesis of autoimmune disease. Nat. Rev. Nephrol. 19, 509–524 (2023). - PMC - PubMed
    1. Spitzer M. H., Gherardini P. F., Fragiadakis G. K., Bhattacharya N., Yuan R. T., Hotson A. N., Finck R., Carmi Y., Zunder E. R., Fantl W. J., Bendall S. C., Engleman E. G., Nolan G. P., IMMUNOLOGY., An interactive reference framework for modeling a dynamic immune system. Science 349, 1259425 (2015). - PMC - PubMed
    1. Lo Y. C., Liu Y., Kammersgaard M., Koladiya A., Keyes T. J., Davis K. L., Single-cell technologies uncover intra-tumor heterogeneity in childhood cancers. Semin. Immunopathol. 45, 61–69 (2023). - PubMed