. 2025 Aug 29;11(35):eady0240.
doi: 10.1126/sciadv.ady0240. Epub 2025 Aug 27.

Putative PINK1/Parkin activators lower the threshold for mitophagy by sensitizing cells to mitochondrial stress

Affiliations

Putative PINK1/Parkin activators lower the threshold for mitophagy by sensitizing cells to mitochondrial stress

William M Rosencrans et al. Sci Adv. .

Abstract

The PINK1/Parkin pathway targets damaged mitochondria for degradation via mitophagy. Genetic evidence implicates impaired mitophagy in Parkinson's disease, making its pharmacological enhancement a promising therapeutic strategy. Here, we characterize two mitophagy activators: a novel Parkin activator, FB231, and the reported PINK1 activator MTK458. Both compounds lower the threshold for mitochondrial toxins to induce PINK1/Parkin-mediated mitophagy. However, global proteomics revealed that FB231 and MTK458 independently induce mild mitochondrial stress, resulting in impaired mitochondrial function and activation of the integrated stress response, effects that result from PINK1/Parkin-independent off-target activities. We find that these compounds impair mitochondria by distinct mechanisms and synergistically decrease mitochondrial function and cell viability in combination with classical mitochondrial toxins. Our findings support a model whereby weak or "silent" mitochondrial toxins potentiate other mitochondrial stressors, enhancing PINK1/Parkin-mediated mitophagy. These insights highlight important considerations for therapeutic strategies targeting mitophagy activation in Parkinson's disease.


Figures

Fig. 1.
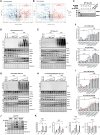
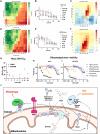
Fig. 1.. PINK1/Parkin activators lower the threshold for mitophagy induction.
(A) Diagram detailing the proposed mechanism of FB231 and MTK458 in activation of the PINK1/Parkin pathway. (B) Confocal imaging of mt-Keima–expressing HeLa cells after treatment with 7.8 nM O/A alone, 7.8 nM O/A and 1.25 μM FB231, or 7.8 nM O/A and 2.5 μM MTK458 for 6 hours. Scale bars (overviews), 20 μm; (insets), 10 μm. (C) mt-Keima assay of YFP-Parkin mt-Keima HeLa cells treated with varying doses of O/A and different doses of the Parkin activator FB231 for 6 hours, each colored uniquely. Data are normalized to dimethyl sulfoxide (DMSO) alone at 6 hours. Solid lines are fits to the Hill equation to determine the EC50. (D) As in (C), with the compound MTK458. (E) Mitophagy induction threshold, or the O/A EC50, is calculated for each dose of FB231 (blue) and MTK458 (red). Symbols are means ± SD from three independent experiments; *P ≤ 0.05, two-way analysis of variance (ANOVA).
Fig. 2.
Fig. 2.. Parkin/PINK1 activators enable potent activation of the PINK1/Parkin pathway.
(A) YFP-Parkin/mt-Keima–expressing HeLa cells were treated with O/A and varying doses of FB231, and the mt-Keima signals were measured at 6, 12, and 24 hours after treatment (N = 3). Solid lines represent fits to the Hill equation to determine EC50. (B) As in (A) with MTK458. (C) EC50 of FB231 and MTK458 are calculated for each time point (N = 3). Error represents the SD of residuals of each point from fits to the Hill equation. (D) As in (A) with YFP-Parkin/mt-Keima–expressing WT and PINK1 KO HeLa cells. (E) Immunoblots of mitophagy biomarkers pUb, YFP-Parkin, and COX4I2 in YFP-Parkin/mt-Keima–expressing HeLa cells treated with varying doses of FB231 or MTK458 with or without 10 nM O/A for 6 hours. (F) Normalized densitometry analysis of (E), (N = 2). (G) Flow cytometry analysis of mt-Keima–expressing SH-SY5Y cells treated with different combinations of O/A, FB231, and MTK458 for 24 hours (N = 3). Data represent the proportion of cells undergoing mitophagy as indicated by the ratio of mt-Keima 555/470 nM emission for at least 15 K cells. (H) Immunoblot of COX4I2 in SH-SY5Y cells treated with or without 10 nM O/A for 16 hours alone or in combination with 10 μM FB231 or 5 μM MTK458. (I) Normalized densitometry analysis of COX4I2 in (H), (N = 3). All cells were administered with 20 μM Q-VD-OPh to prevent cell death. Ponceau S stain was used as total protein loading control. Data are presented as means ± SD; **P ≤ 0.01, ***P ≤ 0.001, ****P ≤ 0.0001 [(G) one-way ANOVA; (I) two-way ANOVA]. a.u., arbitrary units.
Fig. 3.
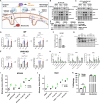
Fig. 3.. FB231 and MTK458 can be used to synergistically enhance mitophagy.
(A) YFP-Parkin/mt-Keima–expressing HeLa cells were treated with 10 nM O/A and varying combinatorial doses of FB231 and MTK458 for 6 hours, whereupon mt-Keima signal was measured. Each combinatorial dose is represented as colored points connected with solid lines. Three cell wells are measured for each point. (B) ZIP Synergy score calculated for each dose of FB231 and MTK458 from (A). Positive synergy (blue) peak is observed in the region around 1.25 μM FB231 and 2.5 μM MTK458. Negative synergy (yellow) is observed at the highest doses of FB231. (C) YFP-Parkin/mt-Keima HeLa cells were treated with combinatorial doses identified in (B) to induce synergy for 6 hours and analyzed via Western blot. Western blotting detected pUb for cells treated with varying doses of FB231 or MTK458 and with or without 10 nM O/A. Ponceau stain is used as a total protein loading control. (D) Normalized densitometry analysis of (C). Solid colors represent measured pUb signal compared to the additive signal expected if the combination of the compounds were purely additive (checkered). Data in (D) are means ± SD from three independent experiments; **P ≤ 0.01 (two-way ANOVA).
Fig. 4.
Fig. 4.. Label free proteomics identifies the ISR as off-target effects of FB231 and MTK458.
(A and B) Volcano plots of label-free proteomics of YFP-Parkin–expressing HeLa cells treated for 12 hours with DMSO, (A) 20 μM MTK458, or (B) 10 μM FB231. Proteins with lower expression levels compared to DMSO (log2-fold-change < −1, P < 0.05) in blue; proteins with higher expression compared to DMSO (log2-fold-change >1, P < 0.05) in red. (C) Immunoblot of PINK1 in WT HeLa cells treated with various combinations of O/A, FB231, MTK458, and MG132 proteasome inhibitor for 16 hours. β-Actin was used as protein loading control. (D) Immunoblots of proteins involved in mitophagy, mitochondrial stress, and ISR in YFP-Parkin–expressing HeLa cells treated with 10 nM O/A and 0.3 to 10 μM FB231 for 16 hours. (E) As in (D) with WT HeLa cells. (F) Normalized densitometry analysis of ATF4 ISR biomarker in (D) and (E), (N = 3). (G) As in (D) with 0.6 to 20 μM MTK458. (H) As in (G) for YFP-Parkin/PINK1KO HeLa cells. (I) Normalized densitometry analysis of ATF4 in (G) and (H), (N = 3). (J) Immunoblots of IFRD1, ATF3, ATF4, and FECH in WT SH-SY5Y cells treated with 10 nM O/A, 10 μM FB231, and 5 μM MTK458 for 16 hours. (K) Normalized densitometry analysis of (J), (N = 3). All cells were administered with 20 μM Q-VD-OPh to prevent cell death. Ponceau S stain was used as a total protein loading control, unless stated otherwise. Data are presented as means ± SD; *P ≤ 0.05, **P ≤ 0.01, ***P ≤ 0.001, ****P ≤ 0.0001 (two-way ANOVA).
Fig. 5.
Fig. 5.. FB231 and MTK458 induce mitophagy independently of the ISR.
(A) Diagram detailing the activation of the ISR upon exposure to mitochondrial toxins. (B and C) Immunoblots of ISR biomarkers in (B) WT or (C) YFP-Parkin/PINK1KO HeLa cells treated with 10 nM O/A, 10 μM FB231, and 10 μM MTK458. Inset (i) depicts full-length, MPP-cleaved, and OMA1-cleaved DELE1-HA in (B). (D and E) Normalized densitometry analysis for (B) and (C), respectively (N = 3). (F) Effectiveness of short hairpin RNA (shRNA) KD of HRI by quantitative polymerase chain reaction analysis. (N = 3). (G) Immunoblots of ISR biomarkers in YFP-Parkin–expressing HeLa cells expressing an HRI-targeting shRNA or the same plasmid vector lacking the shRNA-producing region treated with 10 nM O/A, 2.5 μM FB231, or 5 μM MTK458 with and without O/A for 16 hours. (H) Normalized densitometry analysis of integrative stress response biomarkers in (G), (N = 2). (I and J) mt-Keima assay of HRI KD YFP-Parkin/mt-Keima–expressing HeLa cell lines treated with O/A and (I) MTK458 or (J) FB231 for 6 hours (N = 4). (K) Flow cytometry analysis of mt-Keima–expressing HeLa cells treated with DMSO or O/A for 24 hours (N = 3). Data represent the proportion of cells undergoing mitophagy as indicated by the ratio of mt-Keima 555/470 nM emission for at least 30 K cells. All cells, except in (C), were administered with 20 μM Q-VD-OPh to prevent cell death. Ponceau S stain was used as a total protein loading control. Data are presented as mean ± SD; *P ≤ 0.05, **P ≤ 0.01, ***P ≤ 0.001, ****P ≤ 0.0001 [(D), (E), and (K): two-way ANOVA; (F) Student’s t test.
Fig. 6.
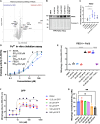
Fig. 6.. FB231 induces mitophagy through an iron-chelation–based mechanism.
(A) Volcano plot of TPP of YFP-Parkin–expressing HeLa cell lysate treated with 40 μM FB231 compared to equivalent DMSO-treated lysate. Significantly destabilized proteins compared to DMSO, with fold change < −1 and P < 0.05 indicated in blue. Proteins significantly stabilized compared to DMSO, fold-change >1 and P < 0.05 indicated in red. Gene names of significantly altered proteins are labeled. (B) Immunoblots of iron-sensitive protein IREB2 in YFP-Parkin–expressing HeLa cells treated with various doses of FB231 or in combination with 10 nM O/A. (C) Normalized densitometry analysis of (B), (N = 3). (D) In vitro ferrous ion (Fe2+) chelation assay using colorimetric analysis of ferrozine. EDTA, DFP, and FB231 chelation ability is normalized to the maximum chelating activity observed for EDTA. Points represent means and SD (N = 3) for individual well measurements, and solid lines represent corresponding fits of the data to a four-parameter Hill equation use to determine the EC50. (E) mt-Keima–based mitophagy assays for YFP-Parkin HeLa cells treated alone or in combinations of FB231, 10 nM O/A, 25 μM FeSO4, and 100 nM O/A for 24 hours (N = 6). (F) mt-Keima–based mitophagy assay of YFP-Parkin/mt-Keima–expressing HeLa cells treated with varying doses of O/A and previously reported mitochondrial toxin DFP for 24 hours. (G) Mitophagy induction threshold, the EC50 of O/A for mitophagy, is calculated for each dose of DFP (N = 3). All cells were administered with 20 μM Q-VD-OPh to prevent cell death. Data are presented as means ± SD; *P ≤ 0.05, **P ≤ 0.01, ****P ≤ 0.0001 (one-way ANOVA).
Fig. 7.
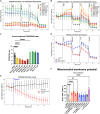
Fig. 7.. FB231 and MTK458 inhibit mitochondrial function through distinct mechanisms.
(A) Raw Seahorse XF OCR plots for WT HeLa cells treated for 6 hours with increasing concentrations of MTK458 (yellow-orange-red), FB231 (green-blue), or DMSO control (black). Cells were treated with inhibitors at the time indicated by the vertical dotted line. (B) OCR plots in (A) normalized to the average of the first four time points for each treatment condition. Data are given as the % of the initial average. (C) Initial OCR/ECAR ratio for cells treated for 6 hours with varying doses of MTK458, FB231, or DMSO control. (D) Normalized OCR plot of WT HeLa cells treated in real time with MTK458, FB231, and DMSO followed by mitochondrial inhibitors at the indicated times (N = 4). (E) Normalized OCR plot of WT HeLa cells treated with either 20 μM MTK458 or DMSO and measured every 7-min for ~2 hours. (F) Flow cytometry analysis of MMP measured by TMRE median fluorescence in cells treated with indicated compound cocktails for 1 to 2 hours before analysis. Each colored dot represents the average of three cell-well replicates from at least four separate experiments. Dotted bars represent the addition of 10 nM O/A. All data from Seahorse experiments represents the means of at least four separate wells. Data are presented as means ± SD; **P ≤ 0.01, ****P ≤ 0.0001 (one-way ANOVA).
Fig. 8.
Fig. 8.. FB231 and MTK458 sensitize cells to mitochondrial stress.
(A) Heatmap showing cell viability in WT HeLa cells treated with combinatorial doses of FB231 and O/A for 24 hours (N = 8). (B) WT HeLa viability dose response curves for O/A at increasing doses of FB231 (N = 8). Solid lines are fits to a Hill equation to determine the IC50. (C) Synergy score heatmap of O/A and FB231 combinations on cell viability. (D) As in (A) for cells treated with MTK458 and O/A. (E) As in (B) for MTK458 (N = 8). (F) As in (C) for MTK458. (G) Plot of calculated O/A viability IC50 at different doses of FB231 (blue) or MTK458 (red). (H) Dose-viability plot of WT HeLa cells in glucose-containing media or galactose-containing media treated with increasing doses of O/A, FB231, or MTK458 for 24 hours (N = 8). Solid lines represent fits the Hill equation. (I) As in (H) for WT SH-SY5Y cells (N = 8). (J) Diagram detailing the activation of PINK1/Parkin-mediated mitophagy and ISR upon exposure to various mitochondrial toxins. Data are presented as means ± SD.
Fig. 9.
Fig. 9.. Mathematical modeling of mitochondrial inhibitors combinations on the induction of mitophagy.
(A) Simplified model of mitochondrial toxin combinations altering mitochondrial function and mitophagy levels via PINK1 accumulation. (B) Mitochondrial function parameter as function of a weak inhibitor (red) with subthreshold mitochondrial toxicity, and a strong inhibitor (blue). The effect of the inhibitor is modeled as a Hill curve, with the response of combinations of inhibitors being multiplied together. Colored dashed curves represent the inhibition of mitochondrial function observed at a range of doses of the strong inhibitor, when cotreated with a constant dose of the weak inhibitor. (C) Apparent mitophagy as a function of inhibitor dose. Mitophagy is modeled as piecewise function dependent on the induction threshold. When mitochondrial function is above the threshold, mitophagy is set at 0. At or below the threshold, mitophagy is modeled as a power-law of the proportion of mitochondrial function below the threshold. The effect of the weak inhibitor is shown in red; the strong inhibitor in blue. Dashed curves represent the mitophagy dose response for the strong inhibitor at varying doses of weak inhibitor. The 50% mitophagy threshold (EC50) is reduced at increasing doses of the weak inhibitor. (D) The relative mitophagy induction threshold of the strong inhibitor, (EC50), is calculated as a function of the weak inhibitor dose. EC50 is normalized to that of the strong inhibitor alone. Each color represents the EC50 of the strong inhibitor calculated for the weak inhibitor’s maximum inhibitory effect on mitochondrial function.

References

    1. Ben-Shlomo Y., Darweesh S., Llibre-Guerra J., Marras C., San Luciano M., Tanner C., The epidemiology of Parkinson’s disease. Lancet 403, 283–292 (2024). - PMC - PubMed
    1. Dickson D. W., Parkinson’s disease and parkinsonism: Neuropathology. Cold Spring Harb. Perspect. Med. 2, (2012). - PMC - PubMed
    1. Moon H. E., Yoon S. H., Hur Y. S., Park H. W., Ha J. Y., Kim K. H., Shim J. H., Yoo S. H., Son J. H., Paek S. L., Kim I. K., Hwang J. H., Kim D. G., Kim H. J., Jeon B. S., Park S. S., Paek S. H., Mitochondrial dysfunction of immortalized human adipose tissue-derived mesenchymal stromal cells from patients with Parkinson’s disease. Exp. Neurobiol. 22, 283–300 (2013). - PMC - PubMed
    1. Tanner C. M., Kamel F., Ross G. W., Hoppin J. A., Goldman S. M., Korell M., Marras C., Bhudhikanok G. S., Kasten M., Chade A. R., Comyns K., Richards M. B., Meng C., Priestley B., Fernandez H. H., Cambi F., Umbach D. M., Blair A., Sandler D. P., Langston J. W., Rotenone, paraquat, and Parkinson’s disease. Environ. Health Perspect. 119, 866–872 (2011). - PMC - PubMed
    1. Flones I. H., Toker L., Sandnes D. A., Castelli M., Mostafavi S., Lura N., Shadad O., Fernandez-Vizarra E., Painous C., Perez-Soriano A., Compta Y., Molina-Porcel L., Alves G., Tysnes O. B., Dolle C., Nido G. S., Tzoulis C., Mitochondrial complex I deficiency stratifies idiopathic Parkinson’s disease. Nat. Commun. 15, 3631 (2024). - PMC - PubMed

MeSH terms

LinkOut - more resources