. 2025 Aug 1;47(8):603.
doi: 10.3390/cimb47080603.

Functional Characterization of Two Glutamate Dehydrogenase Genes in Bacillus altitudinis AS19 and Optimization of Soluble Recombinant Expression

Affiliations

Functional Characterization of Two Glutamate Dehydrogenase Genes in Bacillus altitudinis AS19 and Optimization of Soluble Recombinant Expression

Fangfang Wang et al. Curr Issues Mol Biol. .

Abstract

Glutamate dehydrogenase (GDH) is ubiquitous in organisms and crucial for amino acid metabolism, energy production, and redox balance. The gdhA and gudB genes encoding GDH were identified in Bacillus altitudinis AS19 and shown to be regulated by iron. However, their functions remain unclear. In this study, gdhA and gudB were analyzed using bioinformatics tools, such as MEGA, Expasy, and SWISS-MODEL, expressed with a prokaryotic expression system, and the induction conditions were optimized to increase the yield of soluble proteins. Phylogenetic analysis revealed that GDH is evolutionarily conserved within the genus Bacillus. GdhA and GudB were identified as hydrophobic proteins, not secreted or membrane proteins. Their structures were primarily composed of irregular coils and α-helices. SWISS-MODEL predicts GdhA to be an NADP-specific GDH, whereas GudB is an NAD-specific GDH. SDS-PAGE analysis showed that GdhA was expressed as a soluble protein after induction with 0.2 mmol/L IPTG at 24 °C for 16 h. GudB was expressed as a soluble protein after induction with 0.1 mmol/L IPTG at 16 °C for 12 h. The proteins were confirmed by Western blot and mass spectrometry. The enzyme activity of recombinant GdhA was 62.7 U/mg with NADPH as the coenzyme. This study provides a foundation for uncovering the functions of two GDHs of B. altitudinis AS19.

Keywords: Bacillus; bioinformatics; glutamate dehydrogenase; soluble expression.


Conflict of interest statement

The authors declare no conflicts of interest.

Figures

Figure 1
Figure 1
The phylogenetic tree constructed based on the 16S rRNA sequences of 15 Bacillus species. The pink color represents B. altitudinis AS19. The numbers on each branch node indicate the bootstrap support percentage of the corresponding branch.
Figure 2
Figure 2
The phylogenetic tree of glutamate dehydrogenases GdhA and GudB. Pink represents the glutamate dehydrogenases of B. altitudinis AS19. The numbers on each branch node indicate the bootstrap support percentage of the corresponding branch.
Figure 3
Figure 3
Protein domains of two glutamate dehydrogenases. (a) Protein domain of GdhA. Purple indicates low-complexity regions, and blue indicates the conserved glutamate dehydrogenase domain. (b) Protein domain of GudB. Blue indicates the conserved glutamate dehydrogenase domain.
Figure 4
Figure 4
Secondary and tertiary structure predictions of the two glutamate dehydrogenases. (a,b) Predicted secondary structures of GdhA and GudB proteins. Blue indicates α-helices, purple indicates random coils, red indicates β-sheets, and green indicates β-turns. (c,d) Predicted tertiary structures of GdhA and GudB proteins. Different colors represent different subunits; the bound cofactor NADPH is shown as sticks.
Figure 5
Figure 5
PCR amplification of gdhA and gudB. (a) Electrophoresis map of gdhA PCR. M represents DNA marker, “-” represents the negative control, and 1–6 represent the PCR products of gdhA. (b) Electrophoresis map of gudB PCR. M represents DNA marker, “-” represents the negative control, and 1–6 represent the PCR products of gudB.
Figure 6
Figure 6
Screening and identification of recombinant plasmids. (a) Electrophoresis map of colony PCR for pET28a-gdhA. M represents DNA marker, 1–10 are the numbers of the colonies. (b) Electrophoresis map of colony PCR for pET28a-gudB. M represents DNA marker, 1–10 are the numbers of the colonies.
Figure 7
Figure 7
SDS-PAGE analysis of recombinant protein expression. (a) Recombinant GdhA expression at 24 °C with 0.2 mmol/L IPTG for various durations. M: Genstar 180 protein marker. Lane 1: Uninduced cells. Lanes 2–4: 12 h induction (cells, soluble fraction, pellet). Lanes 5–7: 16 h induction (cells, soluble fraction, pellet). Lanes 8–10: 20 h induction (cells, soluble fraction, pellet). Lanes 11–13: 24 h induction (cells, soluble fraction, pellet). (b): Recombinant GudB expression at 28 °C with 0.2 mmol/L IPTG for 20 h. M: Solarbio Rainbow 180 protein marker. Lane 1: Empty vector pET28a. Lane 2: Uninduced cells. Lanes 3–4: Induced cells (soluble fraction, pellet). (c): Recombinant GudB expression at 16 °C with 0.1 mmol/L IPTG for 12 h. M: Solarbio Rainbow 180 protein marker. Lane 1: Empty vector pET28a. Lane 2: Uninduced cells. Lane 3: Induced cells. Lanes 4–5: Induced cells (soluble fraction, pellet).
Figure 8
Figure 8
SDS-PAGE analysis of purified recombinant proteins. (a) Purified GdhA. M: Genstar 180 protein marker. Lanes 1–3: Flow-through, wash, and eluate fractions, respectively. (b) Purified GudB. M: Genstar 180 protein marker. Lanes 1–4: Unpurified sample, flow-through, wash, and eluate fractions, respectively. (c) GdhA eluted with gradient imidazole. M: Genstar 180 protein marker. Lane 1: Flow-through. Lane 2: Wash. Lanes 3–7: Eluate fractions with 100 mmol/L, 150 mmol/L, 200 mmol/L, 250 mmol/L, and 300 mmol/L imidazole, respectively.
Figure 9
Figure 9
Detection of purified proteins by Western blot. (a) Purified GdhA. M represents the Solarbio Rainbow 180 Protein Marker. Lanes 1–3 correspond to the flow-through fraction, washing fraction, and elution fraction, respectively, obtained during the purification process. (b) Purified GudB. M represents the Solarbio 180 Protein Marker. Lanes 1–3 correspond to the flow-through fraction, washing fraction, and elution fraction, respectively, obtained during the purification process.
Figure 10
Figure 10
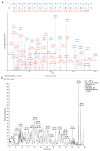
Ion chromatograms of mass spectrometry detection results of recombinant proteins. (a) b/y ion chromatogram of mass spectrometry detection of GdhA. (b) TIC (total ion current) ion chromatogram during mass spectrometry detection of GudB.
Figure 11
Figure 11
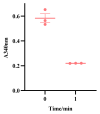
The change in absorbance at 340 nm per minute in the reductive amination reaction system using NADPH as a coenzyme reflects the activity of GdhA.

Similar articles

References

    1. Ye H.-Y., Hou W., Ruan B.-F. The basic characteristics of glutamate dehydrogenase and its inhibitors. Drug Inf. 2019;8:195–201.
    1. Gunka K., Commichau F.M. Control of glutamate homeostasis in Bacillus subtilis: A complex interplay between ammonium assimilation, glutamate biosynthesis and degradation. Mol. Microbiol. 2012;85:213–224. doi: 10.1111/j.1365-2958.2012.08105.x. - DOI - PubMed
    1. Sharkey M.A., Oliveira T.F., Engel P.C., Khan A.R. Structure of NADP+-dependent glutamate dehydrogenase from Escherichia coli--reflections on the basis of coenzyme specificity in the family of glutamate dehydrogenases. FEBS J. 2013;280:4681–4692. doi: 10.1111/febs.12439. - DOI - PMC - PubMed
    1. McPherson M.J., Wootton J.C. Complete nucleotide sequence of the Escherichia coli gdhA gene. Nucleic Acids Res. 1983;11:5257–5266. doi: 10.1093/nar/11.15.5257. - DOI - PMC - PubMed
    1. van Heeswijk W.C., Westerhoff H.V., Boogerd F.C. Nitrogen assimilation in Escherichia coli: Putting molecular data into a systems perspective. Microbiol. Mol. Biol. Rev. 2013;77:628–695. doi: 10.1128/MMBR.00025-13. - DOI - PMC - PubMed

LinkOut - more resources