. 2025 Aug 27;16(1):7987.
doi: 10.1038/s41467-025-63184-w.

CD99-mediated immunological synapse formation potentiates CAR-T cell function

Affiliations

CD99-mediated immunological synapse formation potentiates CAR-T cell function

Giri Nam et al. Nat Commun. .

Abstract

Despite the efficacy of chimeric antigen receptor (CAR)-T cells in selected hematological malignancies, further improvement on CAR-T designs is still desirable. We hypothesize that modifying the CAR structure to enhance immunological synapse (IS) stabilization and CAR target-binding may be a feasible strategy. Here we show that the membrane protein, CD99, is critical for IS formation in T cells by mediating actin-microtubule interaction. CD99 deficiency abolishes IS formation and prevents effective in vivo T cell immunity. Mechanistically, CD99 interacts with microtubules and actins through the transmembrane and cytoplasmic domains, respectively, with which myosin and IQGAP1 interact. As such, incorporating the transmembrane and juxtamembrane domains of CD99 into the CAR structure enhances IS formation and improves the therapeutic efficacy of human CAR-T cells against lymphoma in immune-deficient mice. Our data thus suggest that CD99-mediated IS stabilization may help improve CAR design and efficacy.


Conflict of interest statement

Competing interests: G.N., H.R.Y., H.B.P., J.E.L., K.C., and E.Y.C. are inventors on a filed patent related to the CAR-T cells. K.C. and E.Y.C. are scientific co-founders and shareholders of Ticaros. H.R.Y., H.B.P., and J.E.L. are employees of Ticaros currently. The remaining authors declare no competing interests.

Figures
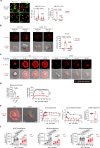
Fig. 1
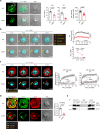
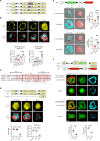
Fig. 1. Requirement of CD99 for IS formation and actin reorganization.
a Fluorescence microscopy images of wild type (WT) or Cd99−/− H60-CTLs (green) coincubated with cognate H60-DCs or control OVA-DCs (red). Numbers of CTLs in contact with one DC (n = 263, 369, 386, and 192 conjugates, from left to right) and the proportion of DCs in contact with more than three CTLs (n = 5 fields per group) are plotted. b Confocal images of phalloidin-stained WT or Cd99−/− H60-CTLs, and control OVA-DC or cognate H60-DCs (cognate DC) after 15 min of coincubation. Polarized CTLs were quantified by identifying cells with higher F-actin intensity at the IS compared to the rear of the CTL (n = 6, 12, 5, and 12 fields, from left to right). Representative single Z-section images of the synapse are shown. Each data point in the graph indicates percentage of polarized cells per field. ce Longitudinal analysis of actin reorganization in anti-CD3-stimulated WT- and Cd99−/−-cells (see Supplementary Movie 1). Time-lapse images of F-actin (Lifeact-mCherry) against black or differential interference contrast (DIC) image background (c). Time in minutes:seconds. Plots of cellular fluorescence intensity expressed in arbitrary units (arb.units) (n = 6 cells per group) (d). Plots of the synapse area (a, white dotted line on cell image) and lamellipodia width (b, black line) at different time points, and distance of the actin-microcluster (MC) from the plasma membrane (c, yellow double-headed arrow) measured at 15–20 min (n = 9 cells per group) (e). f Quantification of nuclear translocation of NFAT (n = 9, 35, 28, 40, 8, 40, 33, and 35 cells, from left to right) and NFκB (n = 23, 24, 35, 38, 24, 20, 37, and 35 cells, from left to right), and phosphorylation of ERK (n = 28, 48, 46, 43, 38, 43, 39, and 34 cells, from left to right) at the indicated time points (see Supplementary Fig. 1e–g). All representative images were obtained from at least 5 randomly selected fields from each group. Data (a, b, df) are presented as mean ± SEM from at least three independent experiments. Statistical significance was assessed using unpaired two-tailed t-test (a, b, d, f), and two-way repeated measures ANOVA with Sidak post-hoc test (d, e). Exact p-values are presented in the figure. Source data are provided as a Source Data file.
Fig. 2
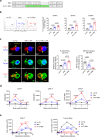
Fig. 2. Requirement of CD99 for microtubule reorganization, and the physical interaction between actin and microtubules.
a Confocal images of WT- and Cd99−/−-cells stained with anti-α-tubulin antibody at 15 min after anti-CD3-stimulation. Plots showing the number of perpendicularly growing microtubules (pMT) in the cell body (CB) and lamellipodia (LP) (n = 12 cells per group), and cellular microtubule (MT) fluorescence intensity (n = 24 cells per group). b, c Longitudinal analysis of microtubule reorganization in Lifeact+ WT- and Cd99−/−-cells (see Supplementary Movies 2, 3). Time-lapse images of microtubules overlaid on DIC (b) and F-actin (c) images. Actin-microtubule colocalization shown in white. Time in minutes:seconds. Plots of microtubule staining (SiR-tubulin+) intensities and pMT numbers (n = 5 cells per group) (b), and actin-microtubule colocalization according to Manders’ coefficient of microtubules colocalized with F-actin (n = 3 cells per group) (c). d Confocal images of F-actin (red) and microtubules (green), and their colocalization (yellow) in WT- and Cd99−/−-cells stained with phalloidin and anti-α-tubulin antibody at 15 min after CD3-stimulation. Plot of actin-microtubule colocalization (n = 12 cells per group). e Immunoblot of actin in coprecipitates of α-tubulin from stimulated WT- or Cd99−/−-cells. Data ae are representative of at least three independent experiments. Data ad are shown as mean ± SEM. Statistical significance was assessed using unpaired two-tailed t-test (a, b, d), and two-way repeated measures ANOVA with Sidak post-hoc test (b, c). Exact p-values are presented in the figure. Source data are provided as a Source Data file.
Fig. 3
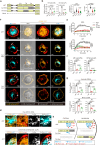
Fig. 3. Importance of the cytoplasmic and transmembrane domains for CD99 function.
a Schematic diagram showing the rWT and mutant CD99s, and mock-YFP. L leader sequence, Myc Myc epitope tag, Ext extracellular domain, TM transmembrane domain, Cyt cytosolic domain. b Plots of actin-microtubule colocalization (n = 6 cells per group), lamellipodia actin width (n = 58, 71, 70, and 71 cells, from left to right), and the number of pMTs (n = 41 cells per group). Related images are shown in Supplementary Fig. 3b. cg Longitudinal analysis of cytoskeleton reorganization and the localization of recombinant CD99 (see Supplementary Movies 5–7). Time-lapse confocal images of microtubules (cyan), F-actin (red), recombinant CD99-YFP (orange-yellow) in rWT, Cyt-Mut, or TM-Mut cells (c). Zoomed images of the peri-MTOC (PM) and lamella-lamellipodia (LLP) regions of the rWT-cells shown in (c, d). Molecular colocalization shown in white. Plots of F-actin and microtubule intensities (n = 5 cells per group) (e), actin-microtubule colocalization in the PM and LLP regions designated in (c, f), and colocalization of F-actin or microtubules with recombinant CD99 with in the cell body (CB) and lamellipodia (LP) at 11 min (rWT-cells) or 14 min (mutant-cells) after stimulation (g). At least 9 randomly selected regions from 5 cells of each group were analyzed from quantitative colocalization of two proteins (f, g). h Localization and domain-mediated interaction with the cytoskeletons of rWT-CD99, Cyt-Mut-CD99, and TM-Mut-CD99. Data bg are representative of at least three independent experiments. Data b, eg are shown as mean ± SEM. Statistical significance was assessed using unpaired two-tailed t-test (b, f, g), and two-way repeated measures ANOVA with Sidak post-hoc test (e). Exact p-values are presented in the figure. Source data are provided as a Source Data file.
Fig. 4
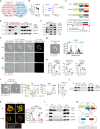
Fig. 4. Identification of IQGAP1 and Myosin IIA as domain-mediated interaction partners of CD99.
a Venn diagram of representative CD99 interactors in the actomyosin and microtubule systems shown in Supplementary Fig. 4a, b, and Supplementary Data 1. b, c Levels of cytoskeletal components in the Cyt-Mut-CD99 or TM-Mut-CD99 interactome, compared to the levels in the rWT interactome. Plots of the log2 fold change (FC) in the values of the majority of the interactors (except for myosin and IQGAP1), myosin (MyoII) proteins, and IQGAP1, as detected in the Cyt-Mut-CD99 and TM-Mut-CD99 interactomes relative to the rWT interactome (n = 2 samples per group) (b). Schematic illustration of the binding of MyoII and IQGAP1 to different recombinant CD99 molecules (c), based on the log2FC values in Supplementary Fig. 4d. d, e Immunoblots of MyoIIA or IQGAP1 in coimmunoprecipitates of rWT-CD99, Cyt-Mut-CD99, and TM-Mut-CD99 (using anti-myc antibody) from the corresponding cells (d), and MyoIIA, IQGAP1, actin, and α-tubulin in coimmunoprecipitates of CD99 (using anti-CD99 antibody) from WT-cells after anti-CD3-stimulation (e). fh Colocalization analysis in rWT and mutant cells. Images of two-way (green) and three-way (white) molecular colocalization (based on Supplementary Fig. 4e) (f). Image of three-way colocalization (rWT-CD99, IQGAP1, and MyoIIA) overlaid on DIC image of rWT-cells, and plot of three-way colocalization signal intensities measured along the line (cyan) across the MTOC (red asterisk) (g). Plots of two-way colocalizations (n = 9 cells per group) (h). i, j Interaction between IQGAP1 and MyoIIA in in WT- or Cd99-/--cells. Confocal images of colocalization (white) between IQGAP1 and MyoIIA on DIC image background of WT- and Cd99−/−-cells. Plots of the IQGAP1 and MyoIIA signal intensities measured along the MTOC-crossing line, and the colocalization (n = 10 cells per group) (i). Immunoblot of MyoIIA in coprecipitates of IQGAP1 (j). k, l Interaction of microtubules with IQGAP1 or MyoIIA in WT- or Cd99−/−-cells. Confocal images of microtubules with IQGAP1 or MyoIIA, and colocalization (yellow). Plots of colocalization of microtubules with IQGAP1 or MyoIIA (n = 9 cells per group) (k). Immunoblot of actin, MyoIIA, and IQGAP1 in coprecipitates of α-tubulin (l). The tubulin and actin immunoblots were reused from Fig. 2e. m CD99 domain-mediated interaction of IQGAP1, MyoIIA, actin, and microtubules. Data (a, b, dl) are representative of two (a, b, j) or three (di, k, l) independent experiments. Data (h, i, k) are shown as mean ± SEM. Statistical significance was assessed using unpaired two-tailed t-test. Exact p-values are presented in the figure. Source data are provided as a Source Data file.
Fig. 5
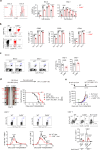
Fig. 5. Ineffective T cell activation and in vivo immunity in the absence of CD99.
a, b Comparison of in vitro activation of CD8+ T cells from WT and Cd99−/− mice. Flow cytometry profiles of CFSE dilution (n = 5 mice per group) (a) and the expression of CD69, CD25, and CD44 (n = 5 mice per group) (b) by anti-CD3/CD28 stimulated WT and Cd99−/− T cells. Plots of the proportions (%) of T cells in each diluted CFSE peak (a) and marker-positive cells (b). Data a, b are pooled from two independent experiments (n = 2–3 mice/group/experiment). c In vivo activation of WT and Cd99−/− J15 CD8+ T cells. Flow cytometry profiles of female Thy1.2+ WT or Cd99−/− J15 CD8+ T cells in the spleens of adoptive hosts (Thy1.1+). The numbers of CD8+Thy1.2+ cells in the spleen on days 3 and 7 post-immunization are plotted (n = 7 mice per group) using data pooled from three independent experiments (n = 2–3 mice/group/experiment). d Comparison of allograft-rejection between female WT and Cd99−/− B6 recipients. Representative images of male BALB.B tail-skin (red arrow) rejected (dotted line) or surviving (solid line), and syngeneic B6 tail-skin (black arrow) on the tail of a WT or Cd99−/− B6 recipient on day 14 post-transplantation. Kaplan-Meier survival plot of the grafts, with median survival time (MST) shown in parentheses. Flow cytometric profiles of H60-tetramer- or H4-tetramer-binding CD11a+ CD8 T cells in blood on day 12 post-transplantation. Plots of the percentage of tetramer-binding cells in blood CD8 T cells. Data represent two independent experiments (n = 9 mice/group/experiment). e B16F10-OVA tumor growth in B6 mice to which were transferred naive CD45.1+ WT or Cd99−/− OT-I CD8 T cells. Tumor sizes and percentages of OVA-tetramer-binding CD45.1+ cells in blood CD8 T cells are plotted. Representative flow cytometric profiles of OVA-tetramer-binding CD45.1+ CD8 T cells on day 10 post-transfer. Data represent two independent experiments (n = 5 mice/group/experiment). Data ae are shown as mean ± SEM. Statistical significance was assessed using unpaired two-tailed t-test (ae), and log-rank (Mantel-Cox) test (d graft survival). Exact p-values are presented in the figure. Source data are provided as a Source Data file.
Fig. 6
Fig. 6. Identification of the transmembrane and juxtamembrane domains as minimal essential domains of mouse and human CD99.
a Schematics of the TM-SR and TM-LR mutant CD99. b Confocal images of recombinant CD99-YFP, F-actin, and microtubules, including their colocalization (white). Plots of microtubule colocalization with actin in MTOC-proximal (n = 8 cells per group) and -distal (n = 10 cells per group) regions in transduced Cd99−/−-cells after 15 min of anti-CD3 stimulation. c Alignment of CD99 amino acid sequences from different organisms using Clustal Omega. Identical sequences are highlighted in red; fully conserved sequences are marked with an asterisk, strongly conserved sequences with a colon, and weakly conserved sequences with a period. Jux, juxtamembrane region. d Functional restoration by TJ-CD99 introduced into Cd99−/−-cells. Schematic of TJ-CD99. Confocal images of recombinant CD99-YFP, F-actin, microtubules, including their colocalization (white) in transduced Cd99−/−-cells. pMT numbers (n = 16 cells per group) and microtubule colocalization with actin (n = 8 cells per group) are plotted. e Cytoskeletal derangements in CD99 knocked-down (KD-HuCD99) Jurkat T cells. Schematic of the DNA construct for human CD99 (sh1-HuCD99) knockdown. Confocal images of actin or microtubules (cyan) in transfected (mCherry-positive) Jurkat T cells after 15 min of anti-CD3 stimulation. Plots of F-actin (n = 12, 15 cells) and microtubule (n = 20, 11 cells) intensities. f Restored IS-cytoskeletal network following HuTJ-CD99 expression in KD-HuCD99-Jurkat cells. Schematic of HuTJ-CD99, mock, and KD (sh1-HuCD99) plasmids. Ms murine CD99, Hu human CD99. Confocal images of HuTJ-CD99 or mock expression (YFP, green) with F-actin or microtubules (red and cyan), and their colocalization (yellow) in KD-HuCD99-Jurkat cells. Plots of lamellipodia (LP) width (n = 21, 25 cells) and pMT numbers (n = 10 cells per group). Data represent three (b, d) or two (e, f) independent experiments. Data b, df are shown as mean ± SEM. Statistical significance was assessed using unpaired two-tailed t-test. Exact p-values are presented in the figure. Source data are provided as a Source Data file.
Fig. 7
Fig. 7. Potentiated IS formation and antitumor effects via CD99 domain-incorporated CAR design.
a Schematic of BBz-CAR and HuTJ-BBz-CAR. b Histogram showing CAR expression on untransduced (UnTD) human T, BBz-CAR-T, or HuTJ-BBz-CAR-T cells. Percentage and mean fluorescence intensity (MFI) values are included. Plots of conjugate formation of UnTD human T, BBz-CAR-T, or HuTJ-BBz-CAR-T cells with Raji tumor cells at different time points of coincubation. In b from left to right, n (fields of coverslips) = 5, 7, and 7. Data are pooled from two independent experiments. c IS formation by CAR-T cells. Z-stacked confocal images of F-actin (red) and microtubules (green), and their colocalization (yellow) in UnTD T, BBz-CAR-T, or HuTJ-BBz-CAR-T cells interacting with CMTMR-labeled Raji cells (blue) after staining with phalloidin and anti-tubulin-α antibody. Arrows indicate polymerized actin enriched near the contact areas (yellow arrows) and the MTOC (green arrows) in T and CAR-T cells. F-actin polarization (Polr) and MTOC translocation (Traslc) are denoted on the image of HuTJ-BBz-CAR-T cells, and plotted (n = 12 conjugates per group). Data represent three independent experiments. d Plots of MFI values of CD69, CD25, and CD44 expressed on UnTD T, BBz-CAR-T, or HuTJ-BBz-CAR-T cells after coculture with Raji cells (n = 4 replicates per group). e In vitro tumor killing assay. Numbers of CAR-T and residual tumor cells were quantified during coculture (n = 3 replicates per group). Data represent two (b, c, e) or three (d) independent experiments. Data be are shown as mean ± SEM. Statistical significance was assessed using unpaired two-tailed t-test. Exact p-values are presented in the figure. Source data are provided as a Source Data file.
Fig. 8
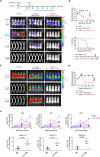
Fig. 8. CD99 domain-incorporated CAR enhances CAR-T cell efficacy in vivo.
a, b Experimental scheme and longitudinal bioluminescence images of tumor cells after injection of high dose (5 × 10⁶) CAR-T cells (a), and plots of bioluminescence intensities and Kaplan-Meier survival curves of hosts, with MSTs shown in parentheses. ud, undetermined (b). c, d Bioluminescence images of tumor cells after injection of low dose (1 × 106) CAR-T cells (c) and plot of bioluminescence intensities of tumor hosts (d). e Plots of BBz-CAR-T or HuTJ-BBz-CAR-T cell numbers in host peripheral blood after infusion. Data are representative of more than three (a) and two (ce) independent experiments (n = 5 mice/group/experiment). Data b, d, e are shown as mean ± SEM. Statistical significance was assessed using two-way repeated measures ANOVA with Sidak post-hoc test (b, d), log-rank (Mantel-Cox) test (b) and unpaired two-tailed t-test (e). Exact p-values are presented in the figure. Source data are provided as a Source Data file.

References

    1. June, C. H., O’Connor, R. S., Kawalekar, O. U., Ghassemi, S. & Milone, M. C. CAR T cell immunotherapy for human cancer. Science359, 1361–1365 (2018). - PubMed
    1. Labanieh, L. & Mackall, C. L. CAR immune cells: design principles, resistance and the next generation. Nature614, 635–648 (2023). - PubMed
    1. Dotti, G., Gottschalk, S., Savoldo, B. & Brenner, M. K. Design and development of therapies using chimeric antigen receptor-expressing T cells. Immunol. Rev.257, 107–126 (2014). - PMC - PubMed
    1. Morris, E. C., Neelapu, S. S., Giavridis, T. & Sadelain, M. Cytokine release syndrome and associated neurotoxicity in cancer immunotherapy. Nat. Rev. Immunol.22, 85–96 (2022). - PMC - PubMed
    1. Morgan, R. A. et al. Case report of a serious adverse event following the administration of T cells transduced with a chimeric antigen receptor recognizing ERBB2. Mol. Ther.18, 843–851 (2010). - PMC - PubMed

MeSH terms

LinkOut - more resources