. 2025 Aug 27;16(1):8016.
doi: 10.1038/s41467-025-62943-z.

The balance between B55α and Greatwall expression levels predicts sensitivity to Greatwall inhibition in cancer cells

Affiliations

The balance between B55α and Greatwall expression levels predicts sensitivity to Greatwall inhibition in cancer cells

Róbert Zach et al. Nat Commun. .

Abstract

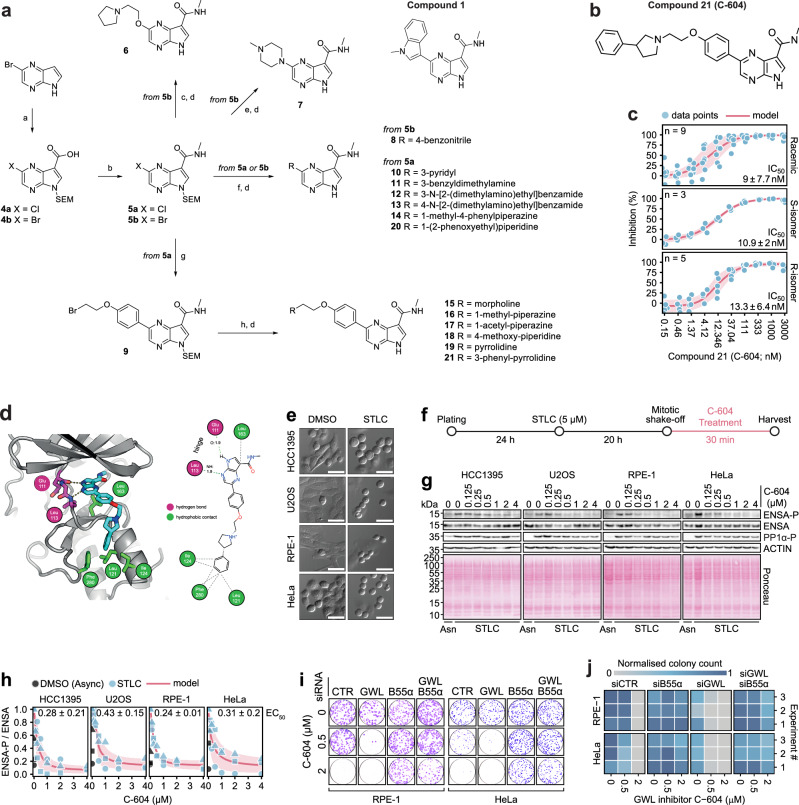
The Greatwall kinase inhibits PP2A-B55 phosphatase activity during mitosis to stabilise critical Cdk1-driven mitotic phosphorylation. Although Greatwall represents a potential oncogene and prospective therapeutic target, our understanding of the cellular and molecular consequences of chemical Greatwall inactivation remains limited. To address this, we introduce C-604, a highly selective Greatwall inhibitor, and characterise both immediate and long-term cellular responses to the chemical attenuation of Greatwall activity. We demonstrate that Greatwall inhibition causes systemic destabilisation of the mitotic phosphoproteome, premature mitotic exit and pleiotropic cellular pathologies. Importantly, we show that the cellular and molecular abnormalities associated with reduced Greatwall activity are specifically dependent on the B55α isoform, rather than other B55 variants, underscoring PP2A-B55α phosphatases as key mediators of the cytotoxic effects of Greatwall-targeting agents in human cells. Additionally, we establish that sensitivity to Greatwall inhibition varies in different cell line models and that dependency on Greatwall activity reflects the balance between Greatwall and B55α expression levels. Our findings highlight Greatwall dependency as a cell-specific vulnerability and propose the B55α-to-Greatwall expression ratio as a predictive biomarker of cellular responses to Greatwall-targeted therapeutics.


Conflict of interest statement

Competing interests: D.M.A. and T.A.H. are employees of AstraZeneca. D.M.A. and T.A.H. are AstraZeneca shareholders. All other authors declare no competing interests.

Figures

Fig. 1
Fig. 1. Development and characterisation of the GWL kinase inhibitor C-604.
a Chemical structure of the lead exemplar compound 21 and the general synthetic route towards the preparation of pyrrolopyrazine GWL inhibitors. (a) for 4a, (i) NaH, SEM-Cl, DMF, 0 °C, 4 h; (ii) Arnold’s reagent, CHCl3, 60 °C, 20 h; (iii) NaClO2, KH2PO4, NH2SO3H, 1,4-dioxane/water, 0 °C to rt, 2 h, 35% (three steps); for 4b, (i) hexamine, TFA, MW, 80 °C, 20 min; (ii) NaH, SEM-Cl, DMF, 0 °C to rt, 16 h; (iii) NaClO2, KH2PO4, NH2SO3H, 1,4-dioxane/water, 0 °C to rt, 1.5 h, 14% (three steps); (b) 2 M methylamine in THF, T3P, pyridine, EtOAc, 60 °C, 2-4 h, 89-97%; (c) 2-(pyrrolidin-1-yl)ethanol, CuI, L-proline, K2CO3, DMSO, 100 °C, 16 h, 48%; (d) TFA, DCM, rt, 16 h then ethylenediamine, DCM, rt, 3-6 h, 29-92%; (e) 1-methylpiperazine, CuI, L-proline, K2CO3, DMSO, 100 °C, 16 h, 77%; (f) boronate ester, Pd(dppf)Cl2 · DCM, 1,4-dioxane/water, MW, 120 °C, 30 min, 43-81%; (g) boronate ester, Pd(dppf)Cl2 · DCM, 1,4-dioxane/water, MW, 120 °C, 30 min, 56%; (h) amine, K2CO3, DMF, 95 °C, 1 h, 32-67%. b Chemical structure of the lead compound 21 (C-604). c Dose-dependent effect of compound 21 (C-604) on the in vitro GWL activity measured by an HTRF assay utilising purified full-length GWL (K72M) and ENSA. Per cent (%) inhibition was determined from fluorescence intensity values normalised to the signal measured in the control enzyme-free reaction. Red lines and shaded regions represent means and standard deviations of independently fitted four-parameter sigmoidal models. Dots represent individual measurements. Mean IC50 values ± standard deviations are indicated. Numbers of independent experiments (n) are indicated. d Model engagement of compound 21 (C-604) with the GWL active site. Left, secondary structure molecular cartoon. Amino acid residues predicted to interact with compound 21 are shown in stick representation, with carbon atoms coloured magenta or green if they make hydrogen bonds or hydrophobic contact with the compound, respectively. Right, 2D interaction map. Refer to the associated key for further details. e Representative differential interference contrast (DIC) images of DMSO-treated interphase cells and STLC-treated prometaphase-arrested cells. The scale bar represents 50 µm. f A schematic outline of the experimental procedure to establish cellular EC50 values of the C-604 inhibitor. g Representative Western blots showing the effect of C-604 on ENSA(S67) and ARPP19(S62) phosphorylation. ENSA and ENSA-P refer to total and phosphorylated ENSA/ARPP19 levels, respectively. Phosphorylation of PP1 at T320 (PP1-P) represents a mitotic marker. The experiment was repeated n = 3 times. h Normalised ratios of ENSA-P and ENSA levels in prometaphase-arrested cells treated with C-604. Data were normalised to the maximum value in each given set. Dots, triangles and squares indicate the results of n = 3 independent experiments. Red lines and shaded regions represent means and standard deviations of n = 3 independently fitted four-parameter sigmoidal models. Mean C-604 EC50 values ± standard deviations are shown for each tested cell line. i Colony formation capacity of RPE-1 and HeLa cells transfected with siRNAs targeting GWL or B55α. Cells were treated with C-604 for 72 h and subsequently grown in a drug-free medium for 7-10 days. Representative images from one of n = 3 experiments are shown. j Quantification of data presented in (e). In each experiment, cell-line-specific colony counts were normalised to the highest recorded value. The results of n = 3 independent experiments are shown as individual rows in the heatmap.
Fig. 2
Fig. 2. Characterisation of long-term cellular consequences of GWL inhibition by C-604.
a Representation of the object and feature extraction utilising Cellpose segmentation. b Demonstration of object classification based on distributions of Hoechst, EdU and p21 intensities. c Representative images of cells treated with C-604 for 72 h. Yellow and cyan outlines indicate segmented cells and nuclei, respectively. d Distributions of cell cycle groups, proportions of quiescent/senescent p21+ cells, frequency of polynucleated cells, and normalised cell areas in cell populations treated with C-604 for 72 h. The results of n = 3 independent experiments are shown for each condition as separate columns. The cell cycle state in the stacked bar plot and indication of statistical significance are colour-coded as indicated by the colour legend below the plots. Between 600 (Experiment 1, MM231, 2 µM C-604) and 43,495 (Experiment 3, HeLa, 0 µM C-604) cells were analysed. Statistical significance was determined using an unpaired two-tailed t-test from n = 3 independently determined proportions (%) or median values (cell area). In the cell cycle analysis, only differences in proportions of 4 N and 8 N+ cells were statistically tested. Parametric statistical testing was justified by the Shapiro-Wilk test of normality (Supplementary Fig. 4c). Determined p-values were adjusted for multiple testing using the Benjamini-Hochberg procedure. The effect size analysis (Cohen’s d) is presented in (Supplementary Fig. 4d). e Representative images of WT and p53-null RPE-1 cells treated with C-604. Images from one of n = 3 independent experiments are shown. f Distributions of cell cycle groups and proportions of p21+ cells in WT and p53-null RPE-1 cells treated with C-604. Between 511 (Experiment 3, RPE-1 p53-null, 2 µM C-604) and 7,754 (Experiment 2, RPE-1 WT, 0 µM C-604) cells were analysed. The results of n = 3 independent experiments are shown for each condition as separate columns. Statistical significance was determined from n = 3 independently determined proportions (%) using an unpaired two-tailed t-test. Parametric statistical testing was justified by the Shapiro-Wilk test of normality (p ≥ 0.15). g Euclidean distances between proportions of cell cycle groups in control and C-604-treated cell populations (d). Points represent the results of n = 3 independent experiments. Mean AUC values ± standard deviations are indicated. AUC – area under the curve, ns – not significant, * p < 0.05, ** p < 0.01, *** p < 0.001. The scale bars in (c, e) represent 50 µm.
Fig. 3
Fig. 3. The impact of siRNA-mediated depletion of GWL and B55α-δ on cellular responses to GWL inhibition by C-604.
a Representative images of RPE-1, HeLa and BT-549 cells treated with siRNAs targeting B55α, B55β, B55γ, B55δ or GWL exposed to C-604 for 48 h. Images from one of n = 3 experiments are shown. The scale bar represents 50 µm. b Distributions of cell cycle groups in control and C-604-treated populations depleted of B55α-δ or GWL. The results of n = 3 independent experiments are shown for each condition as separate columns. The cell cycle state in the stacked bar plot and indication of statistical significance are colour-coded as specified by the colour legend below the plots. Between 407 (Experiment 3, BT-549, siB55β, 2 µM C-604) and 32,941 (Experiment 3, HeLa, siB55β, 0 µM C-604) cells were analysed. Statistical significance of differences between proportions of 4 N and 8 N+ cells was determined by an unpaired two-tailed t-test. Parametric statistical testing was justified by the Shapiro-Wilk test of normality (p ≥ 0.46). Determined p-values were adjusted for multiple testing using the Benjamini-Hochberg procedure. ns – not significant, * p < 0.05, ** p < 0.01, *** p < 0.001.
Fig. 4
Fig. 4. Characterisation of mitotic consequences of GWL inhibition by C-604.
a Representative time-lapse images of aberrant mitotic events and consequential cellular defects induced by C-604. Images from one of n = 3 experiments are shown. Arrowheads indicate a cytoplasmic bridge between newborn RPE-1 cells. The asterisk indicates mitotic slippage. b Impact of C-604 on mitotic timing determined as the distance between mitotic entry and the first signs of cytokinesis or mitotic slippage. Purple points represent pooled individual measurements. White points represent medians of n = 3 independent experiments (circle, square, rhombus). Statistical significance was determined from n = 3 medians, using an unpaired two-tailed t-test. Determined p-values were adjusted for multiple testing using the Benjamini-Hochberg procedure. * p < 0.05, ** p < 0.01, *** p < 0.001. c Frequencies of defective mitotic exit. White points represent the results of n = 3 independent experiments. Bars and error bars represent means and standard deviations, respectively. (b, c) 25-50 mitotic events were analysed for each experiment, cell line and condition. d Correlation scatterplots of defective mitotic exit frequencies and magnitudes of cellular responses to C-604 treatment (Fig. 2g). Pearson correlation coefficients are indicated. e Representative image sequence demonstrating C-604-induced cellular fusions between cousin HeLa cells. An image sequence from one of three independent experiments is shown. f Cell lineages (n = 10) of HCC1395, RPE-1 and HeLa cells treated with increasing doses of C-604 for 60 h. Black and red circles represent cell death and fusion events, respectively. g, h Cell division (g) and fusion (h) events per lineage. Points represent individual lineages (n = 10 per condition). Horizontal red lines represent medians.
Fig. 5
Fig. 5. Characterisation of phosphoproteomic changes induced by C-604-mediated GWL inhibition.
a Volcano plots displaying changes in phosphoproteomes of prometaphase-arrested cells treated with 2 µM C-604 for 30 min. False discovery rate (FDR) was calculated from n = 3 independent repeats. An FDR cut-off (FDR ≥ 0.1) was used as a statistical significance threshold. FC – fold change. b Sequence motifs of identified phosphosites with unchanged (not significant) and significantly impacted (negative and positive hits) phosphorylation levels. c FDR values of de-phosphorylated phosphosites identified in B55α-depleted RPE-1 B55α-dd ( + DIA) cells against FDR values of respective phosphosites in control RPE-1 B55α-dd (-DIA) cells. d FC and FDR values of ARPP19(S62), ENSA(S67) and MASTL (T873, S878) phosphosites in indicated cell lines. e, f Biological process (e) and cellular component (f) gene ontology terms significantly enriched in phosphopeptides dephosphorylated in prometaphase-arrested RPE-1 B55α-dd (-DIA) and HeLa cells treated with 2 µM C-604. g Intersection analysis of differentially phosphorylated phosphosites in prometaphase HCC1395, RPE-1 B55α-dd (-DIA) and HeLa cells treated with 2 µM C-604. h FC values of 43 differentially phosphorylated phosphosites identified in all three analysed cell lines, including HCC1395, RPE-1 B55α-dd (-DIA) and HeLa. The phosphosites highlighted in red indicate factors involved in metaphase-anaphase progression.
Fig. 6
Fig. 6. Prediction of cellular sensitivity to GWL inhibition.
a Representative images from one of n = 3 independent experiments demonstrating colony formation capacity of indicated cell lines exposed to C-604 for 72 h and allowed to recover for 7-14 days. The histological origins of the tested cell lines are indicated. b Quantification of colony formation following the exposure to increasing doses of C-604 (a). Dots represent the results of three independent experiments. Red lines and shaded regions represent means and standard deviations of three independently fitted four-parameter sigmoidal models. Mean ED50 values are indicated. c Representative Western blot showing cellular protein levels of GWL, B55α, catalytic PP2A subunit PPP2Cα/β and ENSA/ARPP19. GAPDH was used as a loading control. Scans from one of three experiments are shown. d Quantification of indicated protein levels aligned with respective C-604 ED50 values. In each of n = 3 experiments, protein levels were normalised to GAPDH and scaled so that the highest value equalled 1. Bars and error bars represent the means and standard deviations of three repeats. Pearson correlation coefficients of C-604 ED50 values and protein expression levels are indicated. e Correlation scatterplot demonstrating mean experimental C-604 ED50 and predicted *ED50 values. The mathematical model used to predict *ED50 values is indicated. In the equation, GWL and B55α represent normalised, scaled protein expression levels, as shown in (d). p-value, R2 value and Pearson correlation coefficient are indicated. Statistical significance was determined using a two-tailed t-test as part of the function that calculated the Pearson correlation. The shaded region represents the confidence interval. f Correlations of experimental C-604 ED50 and publicly available RNA expression levels obtained from the DepMap repository. RNA expressions are represented as transcript per million (TPM) values. Pearson correlation coefficients are indicated. Shaded regions represent confidence intervals. g Stratification of 1450 cell lines based on TPM-derived C-604 *ED50 predictions. The most sensitive (BT-549, HeLa, HT-1080) and the most resistant (HCC1395, HCC1937, HCC1143) cell lines, as determined experimentally, are indicated. h Correlation scatterplots of experimental C-604 ED50 or predicted *ED50 values and GWL CRISPR gene dependency scores obtained from the DepMap repository,. Pearson correlation coefficients are indicated.
Fig. 7
Fig. 7. Modulation of GWL dependency by genetic manipulation of B55α expression levels.
a Representative Western blot showing GWL and B55α protein expression levels in CHOL cancer cell lines KKK-D068, KKK-D131, KKU-055 and MMNK1. Scans from one of n = 3 independent experiments are shown. BT-549 and HCC1143 cell lines are included as exemplars of high and low cellular C-604 sensitivity, respectively. b Quantification of n = 3 independent measurements of GWL and B55α protein expression levels accompanied by predicted C-604 *ED50 values. In each experiment, the recorded expression levels were scaled, with the maximum value set to 1. Points represent results of n = 3 independent experiments (circle, square, rhombus). Bars and error bars represent means and standard deviations. c The impact of C-604 on proliferation in indicated cell lines. Cell counts were determined by microscopy and normalised to the maximum values. Bars and error bars represent means and standard deviations of n = 3 independent experiments, respectively. Mean AUC values computed from normalised counts ± standard deviations are indicated. AUC – area under the curve. d Correlation scatterplot of predicted *ED50 and mean AUC values (b, c) in indicated CHOL cancer cell lines (e) Representative Western blot showing GWL and B55α expression levels in WT and B55α-overexpressing U2OS cells. Scans from one of n = 3 experiments are shown. f Quantification of GWL and total B55α protein levels accompanied by predicted C-604 *ED50 values in indicated cell lines. Points represent results of n = 3 independent experiments (circle, square, rhombus). Bars and error bars represent means and standard deviations, respectively. g Representative result of the colony formation assay showing WT and B55α-overexpressing (clone #12) U2OS cell lines exposed to C-604 for 72 h. Images from one of n = 3 independent experiments are shown. h Heatmap showing colony formation capacity of WT and B55α-overexpressing U2OS cells treated with C-604 for 72 h and allowed to recover for 10 days. Results of n = 3 independent experiments are shown as separate columns. Bars and error bars in the bar plot represent the means and standard deviations of C-604 ED50 estimates. Points represent results of n = 3 independent experiments (circle, square, rhombus). i Correlation scatterplot of experimental C-604 ED50 and predicted *ED50 values in WT and B55α-overexpressing U2OS cell lines. The incorrectly predicted clones are indicated. The solid line represents the linear model based on correctly predicted sensitivities to C-604 treatment. r – Pearson correlation coefficient, R2 – coefficient of determination. Predicted C-604 sensitivity was determined using the formula *ED50 = 0.399 × GWL / B55α + 0.406, where GWL and B55α represent scaled GWL and B55α protein expression levels, respectively.
Fig. 8
Fig. 8. Profiling of B55α and GWL RNA expression levels in TCGA cancer-derived biopsies.
a, b RNA expression levels of B55α (a) and GWL (b) in 33 distinct cancer groups. Red and blue points represent expression levels derived from independent matching normal (N) and Tumour (T) tissue samples. White dots represent median values. The number of analysed biopsies is shown in (d). Statistical significance was determined using an unpaired two-tailed Wilcoxon test. Determined p-values were adjusted for multiple testing using the Benjamini-Hochberg procedure. Indicated significance is colour-coded to reflect the positive (red) and negative (blue) differences between T and N samples. nd – not determined, ns – not significant, * p < 0.05, ** p < 0.01, *** p < 0.001, **** p < 0.0001, ***** p < 0.00001. FPKM – fragments per kilobase of transcript per million mapped reads. c Scatter plot displaying differences in median B55α and GWL RNA expression levels (a, b) between tumour and matching normal tissues (T-N). d Ranked predictions of C-604 sensitivity (*ED50) based on B55α and GWL RNA expression levels (a, b) in analysed biopsies. *ED50 values were calculated using the indicated formula. 5% of biopsies predicted to be most sensitive to C-604 treatment (the lowest *ED50) are indicated. e Scatterplot representation of predicted *ED50 values. 5% of the samples with the lowest *ED50 are indicated. f Proportions biopsies with the lowest predicted *ED50 values (5%) in distinct groups of tumours and matching normal tissues. Total cases per group are indicated. ACC adrenocortical carcinoma, BLCA bladder urothelial carcinoma, BRCA breast invasive carcinoma, CESC cervical squamous cell carcinoma and endocervical adenocarcinoma, CHOL cholangiocarcinoma, COAD colon adenocarcinoma, DLBC lymphoid neoplasm diffuse Large B-cell lymphoma, ESCA oesophageal carcinoma, GBM glioblastoma multiforme, HNSC head and neck squamous cell carcinoma, KICH kidney chromophobe, KIRC kidney renal clear cell carcinoma, KIRP kidney renal papillary cell carcinoma, LAML acute myeloid leukaemia, LGG brain lower grade glioma, LIHC liver hepatocellular carcinoma, LUAD Lung adenocarcinoma, LUSC Lung squamous cell carcinoma, MESO mesothelioma, OV ovarian serous cystadenocarcinoma, PAAD pancreatic adenocarcinoma, PCPG pheochromocytoma and paraganglioma, PRAD prostate adenocarcinoma, READ rectum adenocarcinoma, SARC sarcoma, SKCM skin cutaneous melanoma, STAD stomach adenocarcinoma, TGCT testicular germ cell tumours, THCA thyroid carcinoma, THYM thymoma, UCEC uterine corpus endometrial carcinoma, UCS uterine carcinosarcoma, UVM uveal melanoma.

References

    1. Castro, A. & Lorca, T. Greatwall kinase at a glance. J. Cell Sci.131, jcs222364 (2018). - PubMed
    1. Crncec, A. & Hochegger, H. Triggering mitosis. FEBS Lett.593, 2868–2888 (2019). - PubMed
    1. Mochida, S., Maslen, S. L., Skehel, M. & Hunt, T. Greatwall phosphorylates an inhibitor of protein phosphatase 2A that is essential for mitosis. Science330, 1670–1673 (2010). - PubMed
    1. Gharbi-Ayachi, A. et al. The substrate of Greatwall kinase, Arpp19, controls mitosis by inhibiting protein phosphatase 2A. Science330, 1673–1677 (2010). - PubMed
    1. Williams, B. C. et al. Greatwall-phosphorylated Endosulfine is both an inhibitor and a substrate of PP2A-B55 heterotrimers. Elife3, e01695 (2014). - PMC - PubMed

MeSH terms

Substances