. 2025 Aug 27;16(1):8008.
doi: 10.1038/s41467-025-63405-2.

Upstream open reading frame translation enhances immunogenic peptide presentation in mitotically arrested cancer cells

Affiliations

Upstream open reading frame translation enhances immunogenic peptide presentation in mitotically arrested cancer cells

Alexander Kowar et al. Nat Commun. .

Abstract

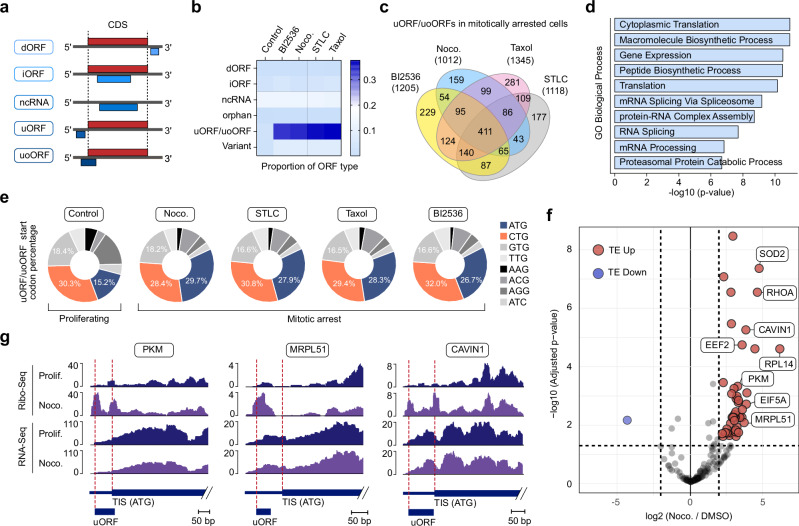
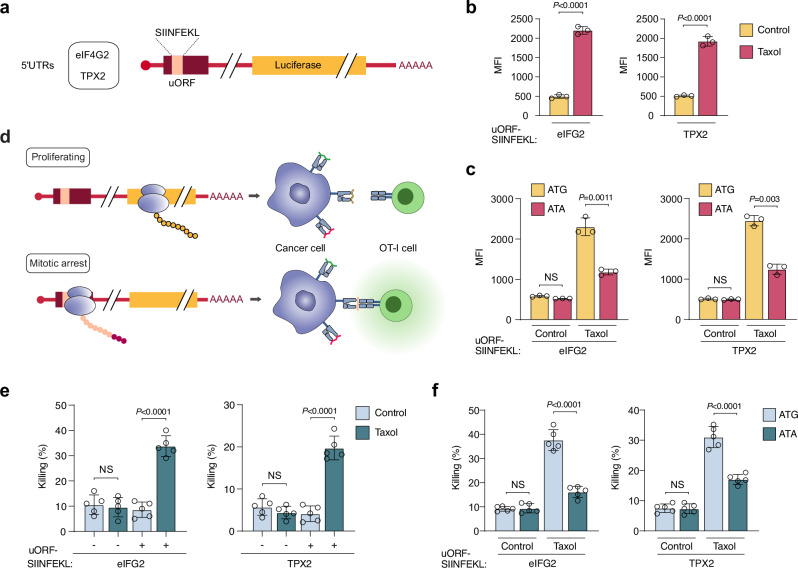
Mitosis is a critical phase of the cell cycle and a vulnerable point where cancer cells can be disrupted, causing cell death and inhibiting tumor growth. Challenges such as drug resistance persist in clinical applications. During mitosis, mRNA translation is generally downregulated, while non-canonical translation of specific transcripts continues. Here, we show that mitotic cancer cells redistribute ribosomes toward the 5' untranslated region (5' UTR) and beginning of the coding sequence (CDS), enhancing translation of thousands of upstream open reading frames (uORFs) and upstream overlapping open reading frames (uoORFs). This mitotic induction of uORF/uoORF enriches human leukocyte antigen (HLA) presentation of non-canonical peptides on the surface of cancer cells after mitotic inhibitor treatment. Functional assays indicate these epitopes provoke cancer-cell killing by T cells. Our findings highlight the therapeutic potential of targeting uORF/uoORF-derived epitopes with mitotic inhibitors to enhance immune recognition and tumor cell elimination.


Conflict of interest statement

Competing interests: The authors declare no competing interests

Figures

Fig. 1
Fig. 1. Prolonged mitotic arrest leads to ribosome redistribution toward the 5′ UTR.
a Representative propidium iodide (PI) staining of U-2 OS cells treated with nocodazole (0.5 µM, 16 h). The bar represents the percentage of cells in G2/M phase. Data from one experiment (n = 1). b Metagene profiles of ribosome-protected fragments (RPFs) in proliferating (blue) and mitotically arrested (green) U-2 OS cells (nocodazole, 0.5 µM, 16 h). Inset magnifies the 5′ UTR. Data from biologically independent experiments (n = 3). c Quantification of RPFs distribution in the 5′ UTR and 3′ UTR of U-2 OS cells treated with vehicle or nocodazole (0.5 µM, 16 h). Mean ± SD from biologically independent experiments (n = 3); P values by two-tailed unpaired t-test. d Heatmap of Pearson correlation coefficients between gene RPKM in U-2 OS cells treated with vehicle (control), BI2536 (0.1 µM), nocodazole (0.5 µM), taxol (1 µM), or STLC (5 µM) for 16 h. e, f Metagene profiles (e) and quantification (f) of RPFs in U-2 OS cells treated as in (d) for 16 h. Inset magnifies the 5′ UTR. Data from one experiment (n = 1). g, h, Metagene profiles (g) and quantification (h) of RPFs in U-2 OS cells treated with vehicle, nocodazole (0.5 µM, 16 h), or nocodazole (0.5 µM, 16 h) combined with torin1 (250 nM, 2 h). Inset magnifies the 5′ UTR. Data from one experiment (n = 1). i Schematic of the run-off elongation experiment in U-2 OS cells. j Metagene profiles of RPFs in U-2 OS cells treated with vehicle or STLC (5 µM, 16 h) and harvested as described in (i). uTIS, upstream translation initiation site. Data from one experiment (n = 1). k Violin plots showing the trimmed mean of M values (TMM) distribution of uTIS in U-2 OS cells treated as in (i). Each point represents a TMM-normalized count at a predicted ORF site. Violin width indicates point density; center line is the median; upper and lower bounds are the 75th and 25th percentiles; whiskers represent minimum and maximum values. P value by one-sided Fisher test (no correction for multiple testing). Data from one experiment (n = 1). Source data are provided as a Source Data file.
Fig. 2
Fig. 2. Increased translation of uORFs/uoORFs in mitotically arrested cancer cells.
a Schematic overview of ORF types detected by PRICE. dORF downstream open reading frame, iORF internal open reading frame, ncRNA noncoding RNA, uORF upstream open reading frame, uoORF upstream overlapping open reading frame. b Proportion of ORFs of each type identified in U-2 OS cells treated with vehicle (Control), BI2536 (0.1 µM), Nocodazole (0.5 µM), Taxol (1 µM), or STLC (5 µM) for 16 h. “Variant” refers to ORFs that contain a stop codon but cannot be categorized as CDS or truncated CDS. “Orphan” refers to ORFs that do not fit into any of the described categories. c Venn diagram showing the number of uORFs/uoORFs identified by PRICE in U-2 OS cells arrested in mitosis with BI2536 (0.1 µM), Nocodazole (0.5 µM), Taxol (1 µM), or STLC (5 µM) for 16 h. d Bar plot showing the combined scores for the GO database “Biological Process” obtained by Enrichr analysis of the common genes described in (c). P values were calculated using a one-sided Fisher’s exact test. Raw P values were adjusted using the Benjamini–Hochberg procedure. e Percentage of translation initiation site codons from uORFs/uoORFs in U-2 OS cells treated with vehicle (Control), BI2536 (0.1 µM), Nocodazole (0.5 µM), Taxol (1 µM), or STLC (5 µM) for 16 h. f Volcano plot illustrating the translation efficiency (TE) of all predicted uORFs/uoORFs in U-2 OS cells treated with 0.5 µM Nocodazole for 16 h. compared to asynchronous cells. The x-axis represents the log2 fold change in TE for uORFs/uoORFs. The y-axis indicates the significance of changes in TE. uORFs/uoORFs with increased TE are highlighted in red, while those with decreased TE are highlighted in blue. Data from two technical replicates. g Read distribution of representative uORFs/uoORFs with increased TE in mitotically arrested U-2 OS cells. RiboSeq (upper panels) and RNA-Seq (lower panels) reads are shown for the 5’UTR and the start of the CDS. Prolif proliferating, Noco Nocodazole.
Fig. 3
Fig. 3. uORF/uoORF-derived HLA-presented peptides exhibit comparable characteristics to annotated peptides.
a Schematic overview of the uORF/uoORF database creation using Riboseq and PRICE prediction, followed by the identification of non-canonical HLA peptides through liquid chromatography-tandem mass spectrometry (LC-MS/MS)-based immunopeptidomics. b Number of peptides mapping to the annotated proteome (left panel) and uORF/uoORF-derived proteome (right panel) of proliferating and mitotically arrested U-2 OS cells. The distribution of predicted binding to HLA alleles in U-2 OS cells is shown. Data from biologically independent experiments (n = 3) c Percentage of eluted ligand (EL) peptides predicted by NetMHCpan-4.1 plotted against predicted binding affinity for peptides derived from the annotated proteome (small dots) and uORF/uoORF-derived peptides (large dots) in proliferating and mitotically arrested U-2 OS cells. Predicted binding to HLA alleles in U-2 OS cells is shown. Peptides are categorized as strong binders (%EL rank 0–0.5), weak binders (%EL rank 0.5–2), or non-binders (%EL rank 2–100). Data from biologically independent experiments (n = 3) d Length distribution of detected peptides mapping to the annotated proteome (left panel) and uORF/uoORF-derived peptides (right panel) in proliferating and mitotically arrested U-2 OS cells. The proportion of predicted binding to U-2 OS HLA alleles is shown. Data from biologically independent experiments (n = 3) e Peptide motif plots of unique peptides from the annotated proteome (6624) and unique peptides derived from uORFs/uoORFs (58), confidently identified as binding to the U-2 OS allele HLA-B44:02. f Observed retention time (RT) plotted against predicted RT indices for peptides from the annotated proteome (black) and uORF/uoORF-derived proteome (red) across all HLA alleles in proliferating and mitotically arrested U-2 OS cells. R² represents the Pearson correlation coefficient. Data from biologically independent experiments (n = 3).
Fig. 4
Fig. 4. Quantitative analysis of HLA-presented uORF/uoORF-derived peptides in mitotically arrested U-2 OS cells.
a Volcano plot illustrating the label-free quantification of the immunopeptidome in Taxol-treated versus DMSO-treated U-2 OS cells, with genes expressing uORF/uoORF-derived peptides highlighted. Peptides with a log2 fold change >0.5 and adjusted P value <0.05 are marked in red, while those with a log2 fold change <−0.5 and adjusted P value <0.05 are marked in blue. Statistical analysis was performed using an empirical Bayes moderated t-test with two-sided P values. Data from biologically independent experiments (n = 3). b Name of the gene expressing the uORF/uoORF-derived peptide, log2 fold change (FC) of peptide abundance, and peptide sequence of mitotic arrest-induced peptides in U-2 OS cells. Data from biologically independent experiments (n = 3). c Read distribution of representative uORFs/uoORFs with increased expression in mitotically arrested U-2 OS cells. Ribo-Seq (upper panels) and RNA-Seq (lower panels) reads are displayed for the 5’ UTR and the start of the coding sequence (CDS).
Fig. 5
Fig. 5. Increased uORF-derived peptide presentation in mitotic cancer cells promotes targeted immune responses.
a Schematic of the uORF reporter system. Two different 5’ UTRs (eIF4G2 and TPX2) were selected and cloned into the pGL3-promoter vector. The sequence of the uORF-derived peptide was replaced with the SIINFEKL sequence, followed by firefly luciferase. b Detection of the p:MHC complex SIINFEKL:H-2Kb by flow cytometry, shown as Median fluorescence intensity (MFI), in TC1 cells transfected with the indicated reporters. Cells were treated with Taxol (1 µM) or DMSO (Control) for 16 h. Data represent mean ± SD from biologically independent experiments (n = 3). P values were calculated using a two-tailed unpaired t-test. c MFI of the SIINFEKL peptide bound to H-2Kb in TC1 cells transfected with wild-type uORF-SIINFEKL reporters or start codon mutant uORF-SIINFEKL reporters. Cells were treated with Taxol (1 µM) for 16 h. Data represent mean ± SD from biologically independent experiments (n = 3). P values were calculated using a two-tailed unpaired t-test. d Schematic illustrating how the presentation of uORF-derived SIINFEKL peptides induced by mitotic arrest leads to OT-I T cell recognition. Proliferating cells expressing uORF-SIINFEKL reporters are not recognized by OT-I cells, whereas enhanced uORF translation in mitotically arrested cells allows for their recognition. e, f Percentage of TC1 cell killing in vitro by activated OT-I cells. TC1 cells were transfected with the indicated reporters and arrested in mitosis with Taxol (1 µM) for 16 hrs. or treated with DMSO for the same period. Data represent mean ± SD from biologically independent experiments (n = 5). P values were calculated using a two-tailed unpaired t-test. NS non-significant. Source data are provided as a Source Data file.
Fig. 6
Fig. 6. Robust T cell immunity against uORF-derived peptides in healthy donors.
a Representative ELISPOT of PBMCs from two healthy donors stimulated with the uORF-derived peptide REMFIWAVA, with DMSO as the negative control. b, ELISPOT quantification from panel (a). Data were presented as spot-forming units (SFU) per 10⁶ PBMCs and represent mean ± SD from technical replicates (n = 3 for DMSO treatment or n = 4 for peptide treatment). SI stimulation index. c IFN-γ and TNF-α expression in CD8⁺ cells from two healthy donors treated with DMSO or the uORF-derived peptide REMFIWAVA. d Representative ELISPOT showing PBMCs from a single healthy donor stimulated with the uORF-derived peptide CSKVSSEY and compared against a DMSO negative control. e Quantification of the ELISPOT results displayed in (d). Data were expressed as spot-forming units (SFU) per 10⁶ PBMCs, presented as the mean ± SD from technical replicates (n = 3 for DMSO; n = 4 for the peptide). SI refers to the stimulation index. f Expression of IFN-γ and TNF-α in CD8⁺ T cells from the same single donor after treatment with DMSO or the uORF-derived peptide CSKVSSEY.

References

    1. Chan, K.-S., Koh, C.-G. & Li, H.-Y. Mitosis-targeted anti-cancer therapies: where they stand. Cell Death Dis.3, e411 (2012). - PMC - PubMed
    1. Tanenbaum, M. E., Stern-Ginossar, N., Weissman, J. S. & Vale, R. D. Regulation of mRNA translation during mitosis. Elife4, e07957 (2015). - PMC - PubMed
    1. Stumpf, C. R., Moreno, M. V., Olshen, A. B., Taylor, B. S. & Ruggero, D. The translational landscape of the mammalian cell cycle. Mol. Cell52, 574–582 (2013). - PMC - PubMed
    1. Park, J.-E., Yi, H., Kim, Y., Chang, H. & Kim, V. N. Regulation of poly(A) tail and translation during the somatic cell cycle. Mol. Cell62, 462–471 (2016). - PubMed
    1. Shuda, M. et al. CDK1 substitutes for mTOR kinase to activate mitotic cap-dependent protein translation. Proc. Natl Acad. Sci. USA112, 5875–5882 (2015). - PMC - PubMed