. 2025 Aug 27;16(1):7205.
doi: 10.1038/s41467-025-61669-2.

Splicing QTL mapping in stimulated macrophages associates low-usage splice junctions with immune-mediated disease risk

Affiliations

Splicing QTL mapping in stimulated macrophages associates low-usage splice junctions with immune-mediated disease risk

Omar El Garwany et al. Nat Commun. .

Abstract

The majority of immune-mediated disease (IMD) risk loci are located in non-coding regions of the genome, making it difficult to decipher their functional effects in relevant physiological contexts. To assess the extent to which alternative splicing contributes to IMD risk, we mapped genetic variants associated with alternative splicing (splicing quantitative trait loci or sQTL) in macrophages exposed to a wide range of environmental stimuli. We found that genes involved in innate immune response pathways undergo extensive differential splicing in response to stimulation and detected significant sQTL effects for over 5734 genes across all stimulation conditions. We colocalised sQTL signals for over 700 genes with IMD-associated risk loci from 22 IMDs with high confidence (PP4 ≥ 0.75). Approximately half of the colocalisations implicate lowly-used splice junctions (mean usage ratio <0.1). Finally, we demonstrate how an inflammatory bowel disease (IBD) risk allele increases the usage of a lowly-used isoform of PTPN2, a negative regulator of inflammation. Together, our findings highlight the role alternative splicing plays in IMD risk, and suggest that lowly-used splicing events significantly contribute to complex disease risk.


Conflict of interest statement

Competing interests: C.A.A. has received research grants or consultancy/speaker fees from Genomics plc, BridgeBio, G.S.K. and AstraZeneca. D.J.G. was an employee of BioMarin and N.I.P. was an employee of G.S.K. at the time the manuscript was submitted. The remaining authors do not declare any competing financial or non-financial interests.

Figures

Fig. 1
Fig. 1. Overview of MacroMap.
Overview of study: a Genotyped iPSC cell lines were differentiated into macrophages, and RNA was harvested before differentiation (Prec_D0) and 2 days after starting differentiation (Prec_D2). RNA was also harvested from differentiated macrophages at 6 and 24 h (Ctrl_6 and Ctrl_24). Naive macrophages were then exposed to a panel of 10 stimuli and RNA was harvested at 6 and 24 h after stimulation. b Split reads were used to quantify intron usage ratios on an individual level using LeafCutter. Split reads were then used for differential splicing analysis between naive and stimulated conditions, and as a quantitative trait to map splicing quantitative trait loci (sQTLs). sQTLs were then colocalised with 22 immune-mediated disease GWAS summary statistics.
Fig. 2
Fig. 2. Uniform Manifold Approximation and Projection of all MacroMap conditions and differential splicing analysis results.
UMAP of intron usage ratios in different stimulation conditions, coloured both by (a) different stimulation conditions and (b) by time point. c Number of differentially spliced genes between naive and stimulated macrophages after 6 h (yellow) and 24 h (blue). d Volcano plot showing differentially spliced genes 6 h after sLPS stimulation, with log effect size on the x-axis (for each gene the intron with the largest absolute effect size is shown) and -log10 of adjusted P-value on the y-axis (Leafcutter P-values were FDR-adjusted). Colours indicate the direction of intron usage change (blue indicating reduced usage and red indicating greater usage in stimulated cells versus naive cells). Genes that belong to the “vesicle-mediated transport” REACTOME pathway are indicated. Prec: iPSC precursor, Ctrl: Control, sLPS: Lippolysaccharide, IL4: Interleukin 4, IFNG: Interferon γ, IFNB: Interferon β, CIL: CD40 + IFNG + sLPS, R848 Resiquimod, PIC: PolyI:C, LIL10: sLPS + Interleukin 10, P3C: Pam3CSK4, MBP: Myelin Basic Protein. D0: Day 0 of iPSC differentiation, D2: Day 2 of iPSC differentiation, 6: 6 h following stimulation, 24: 24 h following stimulation.
Fig. 3
Fig. 3. Significant sQTLs show stimulation-specificity.
a Cumulative number of genes with significant splicing QTL effects, with unstimulated conditions indicated in grey. b Total number of significant sQTLs per condition and proportion of response sQTLs within each condition (sQTLs with LFSR < 0.05; Methods). c Number of genes, per condition, with at least one response sQTL at 6 h, 24 h or both.
Fig. 4
Fig. 4. Colocalisation of sQTLs with immune-mediated disease risk loci.
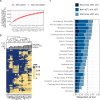
a Cumulative number of genes with GWAS-sQTL colocalisations (PP4 ≥ 0.75) across different conditions, with unstimulated conditions shown in grey on the left. b Heatmap and hierarchical clustering of LFSR values for all the colocalised sQTL effects (PP4 ≥ 0.75) across all 22 IMDs. On top of the heatmap is a barplot showing the proportion of colocalised sQTL effects that are response sQTLs (LFSR < 0.05). c Proportion of genome-wide significant loci that share a single causal variant (PP4 ≥ 0.75) with an eQTL only, an sQTL only or both.
Fig. 5
Fig. 5. Low-usage introns underping immune-mediated disease risk loci.
a Distribution of high-genotype intron usage ratio (IUR) for colocalised introns, showing a peak close to 0 (b) number of samples where each intron is supported by at least one split read (y-axis) shown against the high-genotype IUR of each sample (x-axis). Red vertical line at high-genoype IUR = 0.1. c Distribution of high-genotype IUR for colocalised introns coloured by annotation in GENCODE v45, showing an enrichment of unannotated introns among introns with high-genotype IUR < 0.1 (d) proportion of colocalised splice junctions with either a known acceptor/donor combination (DA), a novel donor (A), a novel acceptor (D) a novel combination of known donor/acceptor splice sites (NDA), or a novel acceptor and donor (N) for colocalised common-usage and colocalised low-usage splice junctions.
Fig. 6
Fig. 6. Example of colocalisation between an IBD risk locus at 18p11.21 and an sQTL for PTPN2.
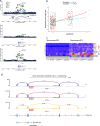
a GWAS regional association plots of the IBD association signal (top), and sQTL association signal for the splice junction chr18:12,817,365-chr18:12,818,944 in unstimulated macrophages (Ctrl_6; middle) and macrophages stimulated with sLPS after 6 h (sLPS_6; bottom). Lead IBD SNP rs80262450 is indicated with an arrow. Colours represent linkage disequillibrium  with the index SNP. b Normalised intron usage ratios of different genotypes of the lead IBD SNP rs80262450 in Ctrl_6 and sLPS_6, (c) heatmap showing evidence of colocalisation (PP4) between the IBD association signal at 18p11.21 and all macrophage eQTLs/sQTLs in the locus (in all conditions), (d) RNA-seq coverage of the intron cluster where the PTPN2 sQTL effect is detected in sLPS_6 stratified by the number of copies of the alternative allele of rs80262450. Bars represent the number of reads and arcs represent the usage of different introns (only five splice junction ratios are shown for clarity and the colocalised sQTL splice junction is indicated in a red box). Canonical transcript PTPN2-201 and non-canonical transcript PTPN2-205 (the only annotated transcript with the implicated splice junction) are shown underneath, with blue boxes representing exons and the position of rs80262450 on PTPN2-205 is shown by the green line. A similar RNA-seq coverage plot in unstimulated macrophages (Ctrl_6) is shown in Supplementary Fig. 21.
Fig. 7
Fig. 7. TOM1 and DENND1B sQTLs colocalise with Crohn’s disease signals.
a Diagram showing different stages of vesicle-mediated transport. TOM1 and DENND1B, two regulators of endosomal trafficking are shown (created with BioRender.com). b GWAS regional association plots for the UC locus at 22q12.3 and the TOM1 sQTL in stimulated macrophages (in CIL_6) showing high colocalisation evidence. c Regional association plots for the IBD locus at 1q31.1 and DENND1B sQTL in stimulated macrophages (CIL_24). Horizontal dotted lines indicate genome-wide significance (P-value = 5 × 10−8). Lead IBD and UC SNPs are indicated with an arrow. Colours represent linkage disequllibrium with the index SNP. “Created in BioRender. El Garwany, O. (2025) https://BioRender.com/d8jdwgf ”.

References

    1. Maurano, M. T. et al. Systematic localization of common disease-associated variation in regulatory DNA. Sci. (N. Y., N. Y.)337, 1190–1195 (2012). - PMC - PubMed
    1. Schaub, M. A. et al. Linking disease associations with regulatory information in the human genome. Genome Res.22, 1748–1759 (2012). - PMC - PubMed
    1. Võsa, U. et al. Large-scale cis- and trans-eQTL analyses identify thousands of genetic loci and polygenic scores that regulate blood gene expression. Nat. Genet.53, 1300–1310 (2021). - PMC - PubMed
    1. GTEx Consortium The GTEx Consortium atlas of genetic regulatory effects across human tissues. Sci. (N. Y., N. Y.)369, 1318–1330 (2020). - PMC - PubMed
    1. Kerimov, N. et al. A compendium of uniformly processed human gene expression and splicing quantitative trait loci. Nat. Genet.53, 1290–1299 (2021). - PMC - PubMed

Substances

LinkOut - more resources