. 2025 Aug 27;16(1):8009.
doi: 10.1038/s41467-025-63376-4.

Remodeling adipocytes' lipid metabolism with a polycation loaded enzyme-active framework reverses osteoporotic bone marrow

Affiliations

Remodeling adipocytes' lipid metabolism with a polycation loaded enzyme-active framework reverses osteoporotic bone marrow

Wenzheng Lin et al. Nat Commun. .

Abstract

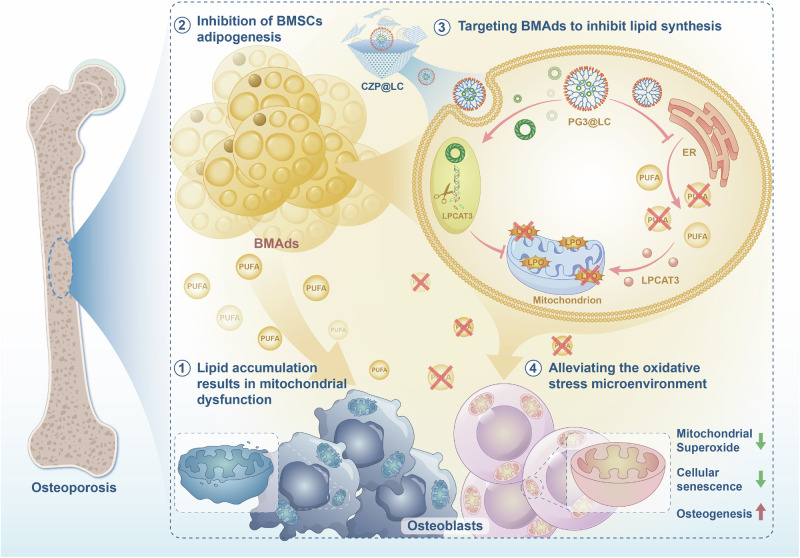
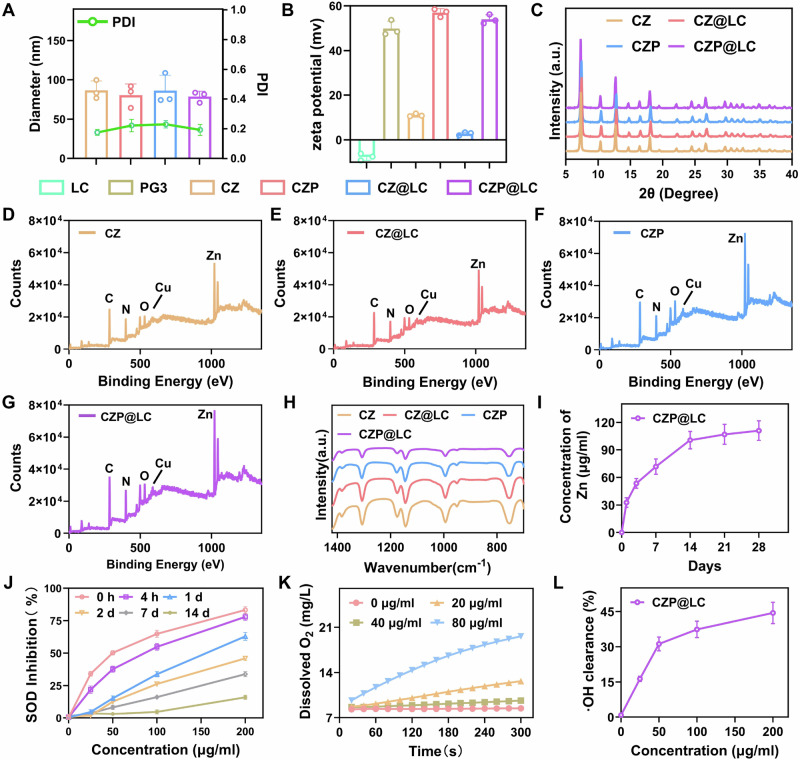
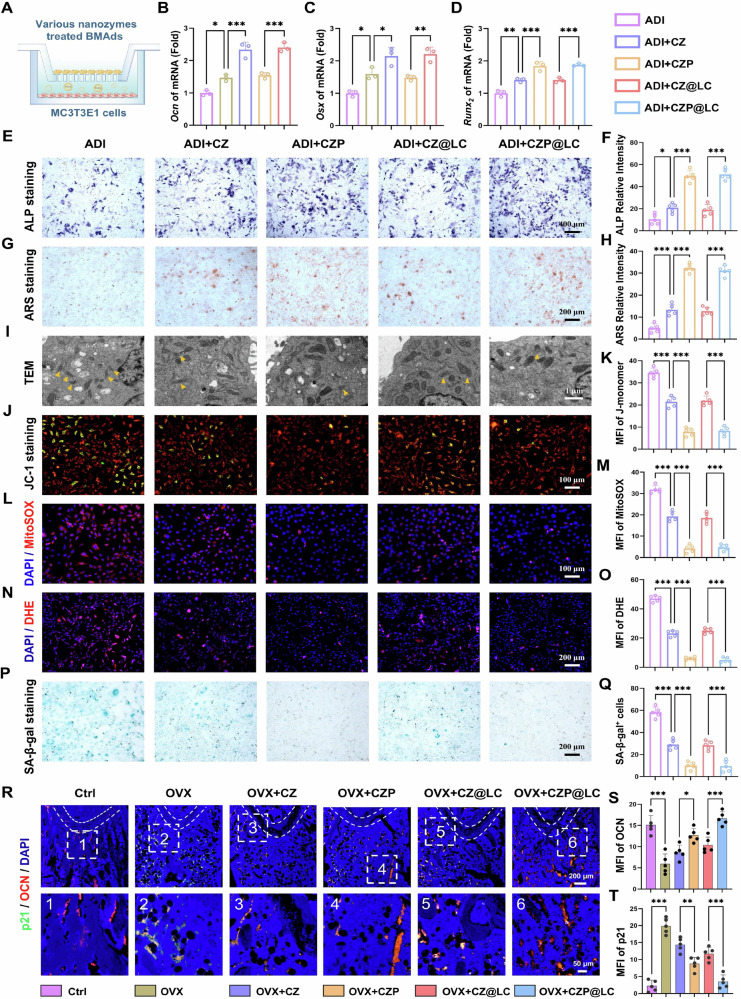
The function of osteoporosis-induced bone marrow adipocyte (BMAds) accumulation remains inadequately understood. Here, we analyze bone marrow lipidomic data and reveal that BMAds deteriorate the skeletal microenvironment by secreting large amounts of lipids, altering the senescence status of neighboring cells by affecting their mitochondrial function. To specifically target BMAds under osteoporotic conditions, we design a polycation-loaded biomimetic dual-site framework (CZP@LC) that interferes with lipid crosstalk between BMAds and neighboring bone marrow cells. Shutting down abnormal lipid metabolism and secretion in adipocytes mitigates mitochondrial dysfunction in neighboring cells, which prevents bone marrow cells from senescing. The inhibition of lipid synthesis in BMAds blocks bone marrow stromal cells from differentiating into adipocytes, interrupting the vicious cycle. Moreover, interruption of lipid communication rescues osteoblasts from mitochondrial dysfunction-induced senescence and restores osteogenesis. Here we demonstrate the metabolic mechanisms of BMAds and lipid crosstalk in osteoporosis, provide a potential avenue for targeted biotherapy.


Conflict of interest statement

Competing interests: The authors declare no competing interests.

Figures

Fig. 1
Fig. 1. Schematic diagram of CZP@LC regulation of BMAds lipid metabolism.
CZP@LC rescues collapsed bone marrow in osteoporotic conditions through targeted remodeling of lipid metabolism in bone marrow adipocytes.
Fig. 2
Fig. 2. The accumulation of bone marrow adipocytes (BMAds) alters the microenvironment.
A Representative microcomputed tomography (μCT) images of mouse femurs from the control group or after 4 or 8 weeks of ovariectomy (OVX) (scale bars: 0.5 mm). B, C Quantitative μCT analysis of bone volume per tissue volume (BV/TV) and trabecular separation (Tb.Sp) was performed on femurs (n = 5). D, E Representative images of HE staining and immunofluorescence images of PPARγ after 4 or 8 weeks of OVX and the control. F Simplified schematic representation of the lipidomic analysis. G Bubble plots of LIPID MAPS functional categorical enrichment analysis (8-week OVX vs control, n = 6 mice). H Differential lipid thermograms of the control and 8-week OVX groups (n = 6 mice). I, J Representative images of Oil Red O (ORO) staining or alkaline phosphatase (ALP) staining after bone marrow mesenchymal stem cell (BMSC) differentiation via adipogenic induction (ADI) or osteogenic induction (OSI) with or without the addition of AA. K MC3T3-E1 cells were treated with fatty acid agonists (GW1929) or antagonists (GW9662) after coincubation with bone marrow stromal cells (BMSCs) (with or without ADI) for JC-1 or MitoSOX staining. L Representative images of immunofluorescence staining for PINK1 or PARK2 after various treatments. The data were expressed as the means ± SDs. Statistical significance was determined by one-way ANOVA. *p < 0.05, **p < 0.01, ***p < 0.001. (Mouse element from Figdraw (www.figdraw.com) are used in this figure. Microtube and femur elements adapted from Servier Medical Art (https://smart.servier.com/) are used in this figure, licensed under CC BY 4.0 (https://creativecommons.org/licenses/by/4.0/)).
Fig. 3
Fig. 3. Construction and morphology of CZP@LC nanoplatforms.
A Schematic of the synthesis of CZP@LC. B Representative transmission electron microscopy (TEM) images of CZ, CZP, CZ@LC, and CZP@LC. C Elemental mapping confirmed the presence of C, N, Cu, and Zn in CZP@LC. D Agarose gel electrophoresis of various nanoparticles; Lane 1: DNA hyperladder; Lane 2: pure LC plasmid; Lanes 3–5: PG3@LC, CZ@LC and CZP@LC treated at pH 7.4 for 2 days; Lanes 6–8: PG3@LC, CZ@LC and CZP@LC treated at pH 6.0 for 2 days.
Fig. 4
Fig. 4. Enzyme-like activity and physicochemical characterization of CZP@LC.
A The average hydrodynamic particle size of various nanoplatforms (n = 3 independent experiments). B Zeta potential of the LC plasmid, PG3 and synthetic nanoparticles (n = 3 independent experiments). C powder X-ray diffraction (XRD) patterns of various nanoparticles. X-ray photoelectron spectroscopy (XPS) spectra of CZ (D), CZ@LC (E), CZP (F), and CZP@LC (G). H Fourier transform infrared spectroscopy (FT-IR) patterns of the synthetic nanoplatforms. I Inductively coupled plasma (ICP) was used to detect Zn in CZP@LC at different time points (n = 3 independent experiments). J, K The superoxide dismutase (SOD) -like and catalase (CAT) -like activities of CZP@LC were evaluated via a SOD activity assay kit and a dissolved oxygen meter (n = 3 independent experiments). L •OH scavenging capacity of CZP@LC (n = 3 independent experiments). The data were expressed as the means ± SDs.
Fig. 5
Fig. 5. CZP@LC effectively alleviated mitochondrial dysfunction and rescued cellular senescence.
AD JC-1 and mitoSOX staining were used to detect and quantify the mitochondrial function of cells treated with AA and various nanoparticles (n = 5 independent experiments). EH The nanoplatforms alleviated the oxidative stress and senescence caused by AA in MC3T3-E1 cells, as detected and quantified by dihydroethidium (DHE) staining and senescence-associated beta-galactosidase (SA-β-gal) staining (n = 5 independent experiments). IL Representative immunofluorescence images and quantitative analysis of IL-1β and TNF-α in the different groups (n = 5 independent experiments). M, N Representative images and quantitative analysis of DHE fluorescence staining of femoral sections (n = 5 mice). The data were expressed as the means ± SDs. Statistical significance was determined by one-way ANOVA. *p < 0.05, **p < 0.01, ***p < 0.001.
Fig. 6
Fig. 6. Targeting BMAds in vivo and delivery of the LC plasmid in vitro.
A Schematic diagram illustrating the experiments in which BMAds were targeted in vivo. BD Flow cytometry (FCM) assessment and quantification of CZ@LC- and CZP@LC-targeted BMAds in vivo (n = 3 mice). EG Fluorescence images and quantitative analysis of 3T3-L1 cells incubated with CZ@LC or CZP@LC for 0, 24 and 72 h (n = 3 independent experiments). HJ FCM evaluation and quantitative analysis of CZ@LC or CZP@LC uptake by 3T3-L1 cells (n = 3 independent experiments). The data were expressed as the means ± SDs. Statistical significance was determined by two-way ANOVA. *p < 0.05, **p < 0.01, ***p < 0.001. (Mouse and syringe elements from Figdraw (www.figdraw.com) are used in this figure. Microtube and femur elements adapted from Servier Medical Art (https://smart.servier.com/) are used in this figure, licensed under CC BY 4.0 (https://creativecommons.org/licenses/by/4.0/)).
Fig. 7
Fig. 7. CZP@LC inhibits adipogenesis via interference with lipid synthesis in vitro and in vivo.
A, B Representative images and quantification of ORO staining in BMSCs after ADI with different treatments (n = 5 independent experiments). CE Representative images and quantification of BODIPY and LPO staining in BMAds subjected to different treatments n = 5 independent experiments). FH qPCR analysis of gene expression in BMSCs after various ADI treatments (n = 3 independent experiments). I, J Immunofluorescence and quantitative analysis of PPARγ in femoral sections and enlarged images (n = 5 mice). K, L Representative images and quantitative analysis of ORO staining in femoral sections (n = 5 mice). The data were expressed as the means ± SDs. Statistical significance was determined by one-way ANOVA. *p < 0.05, **p < 0.01, ***p < 0.001.
Fig. 8
Fig. 8. CZP@LC promote osteogenesis and protection against cellular senescence due to mitochondrial dysfunction.
A Schematic diagram illustrating the experimental procedure. BD Expression of osteogenesis-related genes (Ocn, Osx, and Runx2) in MC3T3-E1 cells after different treatments (n = 3 independent experiments). EH Representative images and quantitative analyses of ALP and ARS staining (n = 5 independent experiments). I TEM images of the effect of BMAd-generated lipids on the mitochondria of MC3T3-E1 cells (yellow arrows point to mitochondrial cristae). JM Representative images and quantitative analyses of JC-1 and mitoSOX staining (n = 5 independent experiments). NQ Images and quantification of different groups of MC3T3-E1 cells after DHE and SA-β-gal staining (n = 5 independent experiments). RT Immunofluorescence costaining images and quantitative analysis of OCN and p21 in femoral sections (n = 5 mice). The data were expressed as the means ± SDs. Statistical significance was determined by one-way ANOVA. *p < 0.05, **p < 0.01, and ***p < 0.001.
Fig. 9
Fig. 9. The nanoplatforms effectively rescued mitochondrial dysfunction in osteoblasts in vivo.
A, B Levels of PINK1 and PARK2 (C, D) costained with OCN in femoral tissue and the quantitative results (n = 5 mice). The data were expressed as the means ± SDs. Statistical significance was determined by one-way ANOVA. *p < 0.05, **p < 0.01, and ***p < 0.001.
Fig. 10
Fig. 10. CZP@LC reverses osteoporotic bone loss in vivo.
A Representative μCT image of femurs (scale bars: 0.5 mm). B Images obtained from HE staining indicated that more bone microstructures were maintained and that fewer fat vacuoles were present in the CZP@LC-treated OVX mice. CF Quantitative μCT analysis of BV/TV, trabecular thickness (Tb. Th), trabecular number (Tb. N) and Tb. Sp (n = 10 mice). The data were expressed as the means ± SDs. Statistical significance was determined by one-way ANOVA. *p < 0.05, **p < 0.01, and ***p < 0.001.

References

    1. Wang, Y. et al. Bone marrow adipocyte: origin, biology and relationship with hematological malignancy. Int. J. Lab. Hematol.46, 10–19 (2024). - PubMed
    1. Hardouin, P., Rharass, T. & Lucas, S. Bone marrow adipose tissue: to be or not to be a typical adipose tissue? Front. Endocrinol.7, 85 (2016). - PMC - PubMed
    1. Cawthorn, W. P. et al. Bone marrow adipose tissue is an endocrine organ that contributes to increased circulating adiponectin during caloric restriction. Cell Metab.20, 368–375 (2014). - PMC - PubMed
    1. Scheller, E. L., Burr, A. A., MacDougald, O. A. & Cawthorn, W. P. Inside out: Bone marrow adipose tissue as a source of circulating adiponectin. Adipocyte5, 251–269 (2016). - PMC - PubMed
    1. Sulston, R. J. & Cawthorn, W. P. Bone marrow adipose tissue as an endocrine organ: close to the bone? Horm. Mol. Biol. Clin. Investig.28, 21–38 (2016). - PubMed

MeSH terms

LinkOut - more resources