

Constructing multicancer risk cohorts using national data from medical helplines and secondary care
- PMID: 40866501
- PMCID: PMC12391443
- DOI: 10.1038/s41746-025-01855-0
Constructing multicancer risk cohorts using national data from medical helplines and secondary care
Abstract
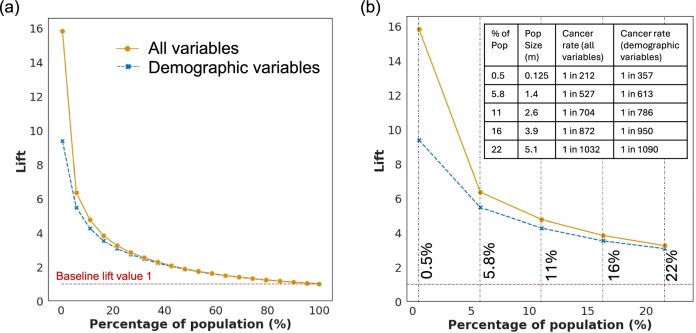
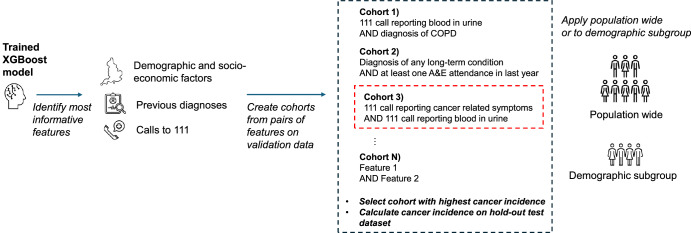
Identification of cohorts at higher risk of cancer can enable earlier diagnosis of the disease, which significantly improves patient outcomes. In this study, we select nine cancer sites with high incidence of late-stage diagnosis or worsening survival rates, and where there are currently no national screening programmes. We use data from medical helplines (NHS 111) and secondary care appointments from all hospitals in England. We show that features based on information captured in NHS 111 calls are among the most influential in driving predictions of a future cancer diagnosis. Our predictive models exhibit good discrimination, ranging from 0.69 (ovarian cancer) to 0.83 (oesophageal cancer). We present an approach of constructing cohorts at higher risk of cancer based on feature importance and considering possible bias in model results. This approach is flexible and can be tailored based on data availability and the group the intervention targets (i.e. symptomatic or asymptomatic patients).
© 2025. The Author(s).
Conflict of interest statement
Competing interests: The authors declare no competing interests.
Figures


Similar articles
-
Prescription of Controlled Substances: Benefits and Risks.2025 Jul 6. In: StatPearls [Internet]. Treasure Island (FL): StatPearls Publishing; 2025 Jan–. 2025 Jul 6. In: StatPearls [Internet]. Treasure Island (FL): StatPearls Publishing; 2025 Jan–. PMID: 30726003 Free Books & Documents.
-
Comparison of Two Modern Survival Prediction Tools, SORG-MLA and METSSS, in Patients With Symptomatic Long-bone Metastases Who Underwent Local Treatment With Surgery Followed by Radiotherapy and With Radiotherapy Alone.Clin Orthop Relat Res. 2024 Dec 1;482(12):2193-2208. doi: 10.1097/CORR.0000000000003185. Epub 2024 Jul 23. Clin Orthop Relat Res. 2024. PMID: 39051924
-
Interventions targeted at women to encourage the uptake of cervical screening.Cochrane Database Syst Rev. 2021 Sep 6;9(9):CD002834. doi: 10.1002/14651858.CD002834.pub3. Cochrane Database Syst Rev. 2021. PMID: 34694000 Free PMC article.
-
Electronic cigarettes for smoking cessation.Cochrane Database Syst Rev. 2021 Sep 14;9(9):CD010216. doi: 10.1002/14651858.CD010216.pub6. Cochrane Database Syst Rev. 2021. Update in: Cochrane Database Syst Rev. 2022 Nov 17;11:CD010216. doi: 10.1002/14651858.CD010216.pub7. PMID: 34519354 Free PMC article. Updated.
-
Electronic cigarettes for smoking cessation.Cochrane Database Syst Rev. 2025 Jan 29;1(1):CD010216. doi: 10.1002/14651858.CD010216.pub9. Cochrane Database Syst Rev. 2025. PMID: 39878158 Free PMC article.
References
-
- Appelbaum, L. et al. Development and validation of a pancreatic cancer risk model for the general population using electronic health records: an observational study. Eur. J. Cancer143, 19–30 (2021). - PubMed
-
- Wang, Y. H., Nguyen, P. A., Mohaimenul Islam, M., Li, Y. C. & Yang, H. C. Development of deep learning algorithm for detection of colorectal cancer in EHR data. in Studies in Health Technology and Informatics Vol. 264, 438–441 (IOS Press, 2019). - PubMed
LinkOut - more resources
Full Text Sources
