. 2025 Oct;646(8084):483-492.
doi: 10.1038/s41586-025-09429-6. Epub 2025 Aug 27.

One-shot design of functional protein binders with BindCraft

Affiliations

One-shot design of functional protein binders with BindCraft

Martin Pacesa et al. Nature. 2025 Oct.

Abstract

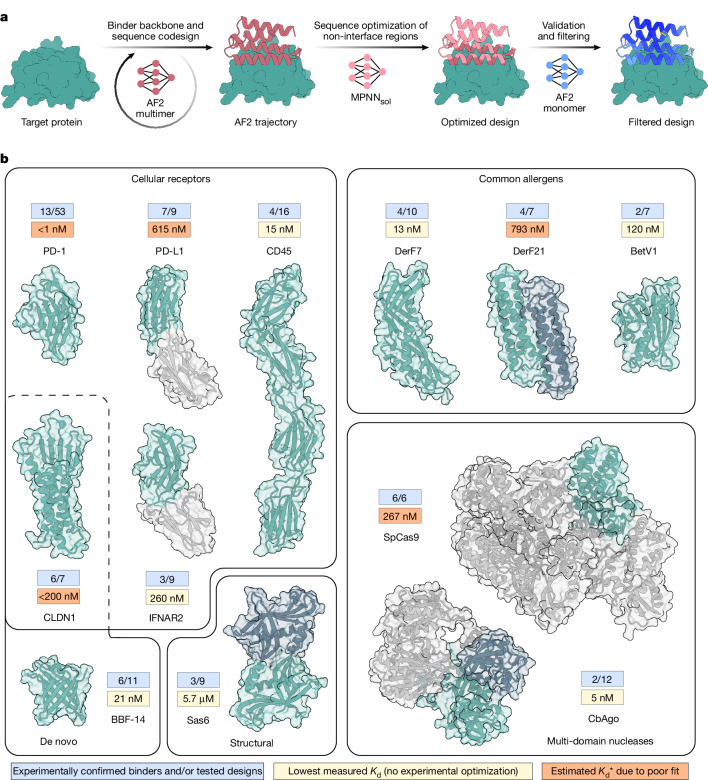
Protein-protein interactions are at the core of all key biological processes. However, the complexity of the structural features that determine protein-protein interactions makes their design challenging. Here we present BindCraft, an open-source and automated pipeline for de novo protein binder design with experimental success rates of 10-100%. BindCraft leverages the weights of AlphaFold2 (ref. 1) to generate binders with nanomolar affinity without the need for high-throughput screening or experimental optimization, even in the absence of known binding sites. We successfully designed binders against a diverse set of challenging targets, including cell-surface receptors, common allergens, de novo designed proteins and multi-domain nucleases, such as CRISPR-Cas9. We showcase the functional and therapeutic potential of designed binders by reducing IgE binding to birch allergen in patient-derived samples, modulating Cas9 gene editing activity and reducing the cytotoxicity of a foodborne bacterial enterotoxin. Last, we use cell-surface-receptor-specific binders to redirect adeno-associated virus capsids for targeted gene delivery. This work represents a significant advancement towards a 'one design-one binder' approach in computational design, with immense potential in therapeutics, diagnostics and biotechnology.


Conflict of interest statement

Competing interests: K.H.G., L.V., B.J.Y. and A.M.W. are employees of Visterra Inc., USA. The remaining authors declare no competing interests.

Figures

Fig. 1
Fig. 1. De novo binder design using BindCraft.
a, Schematic representation of the BindCraft binder design pipeline. Given a target protein structure, a binder backbone and sequence is generated using AF2 multimer, then the surface and core of the binder are optimized using MPNNsol while keeping the interface intact. Finally, designs are filtered based on AF2 monomer model prediction. b, Overview of protein targets for binder design. Parts of the model coloured in green were used during design, grey areas were excluded. Values in the blue box indicate the number of successful designs, where binding was observed on SPR measurement versus the total number of designs tested. Values in the yellow box indicate the measured Kd of the highest affinity binder without experimental sequence optimization, whereas values in orange boxes indicate estimated Kd* values due to poor fit. PD-1 binders were tested as a bivalent Fc fusion.
Fig. 2
Fig. 2. Binder design targeting cell-surface receptors.
a, Design model of binder2 in complex with PD-1. b, Representative BLI sensorgram showing binding kinetics of binder2 (bivalent Fc fusion) to PD-1. c, Design model of binder4 in complex with PD-L1. d, Binding affinity determination by SPR for the PD-L1–binder4 interaction. e, Design model of binder5 in complex with IFNAR2. f, Binding affinity determination by SPR for the IFNAR2–binder5 interaction. g, Design model of binder1 in complex with CD45. h, SPR binding affinity fit for binder1. i, Schematic of CpE-based cytotoxicity and CLDN1 binder inhibition. j, Single cycle kinetic analysis with SPR of CLDN1 binder12 binding to soluble analogues of CLDN1. k, Cell-based assay showing concentration-dependent inhibition of CpE cytotoxicity by CLDN1 binder9, binder12 and CpE inhibitor. Bar plots represent the mean of n = 2 replicates, with standard deviation indicated by error bars. l, MST measurements showing blocking of CpE binding to CLDN1 wild type when preincubated with binder12. MST data were plotted from a single representative measurement. Panel i was created using BioRender (https://biorender.com).
Fig. 3
Fig. 3. Designs occluding epitopes of common allergens.
a, Left: design model of binder2 against dust mite allergen Der f7. Right: SPR binding affinity fit for binder2. b, Crystal structure (coloured) of the Der f7–binder2 complex overlaid with the design model (grey). c, Left: design model of binder10 against dust mite allergen Der f21. Right: SPR binding affinity fit for binder10. d, Crystal structure (coloured) of the Der f21–binder10 complex overlaid with the design model (grey). e, Left: design model of binder2 against birch allergen Bet v1. Right: SPR binding affinity fit for binder2. f, SEC–MALS analysis of Bet v1 allergen (blue, expected molecular weight (MW) 18.5 kDa) and Bet v1 mixed with binder2 (orange, expected molecular weight 29.3 kDa). g, Cryo-EM structure (PDB 7MXL) of Bet v1 bound to commercial anti-Bet v1 REGN antibody mix. h, Competition assay on immobilized REGN5713-Bet v1 complex binding of the REGN5714 antibody but not Bet v1 binder2, confirming binding at the designed site. i, Blocking ELISA showing the capacity of the REGN antibody mix (orange) or binder2 (blue) to prevent the binding of Bet v1 to IgE from the sera from three patients allergic to birch. Number suffix represents individual serum from a patient. Data points represent average of two technical replicates with the error bars depicting standard deviation.
Fig. 4
Fig. 4. Targeting nucleic acid interactions with de novo binders against nucleic acid-guided multi-domain nucleases.
a, Zoom in on the SpCas9 REC1 domain with bound guide RNA (PDB 4ZT0). A designed binder is overlaid in the binding pocket. b, Cryo-EM structure of binder3 bound to the apo form of SpCas9. The REC1 domain is highlighted in green, the rest of SpCas9 is in grey. Cryo-EM density overlaid in grey. c, Cryo-EM structure of binder10 bound to the apo form of SpCas9. The REC1 domain is highlighted in green, the rest of SpCas9 is coloured in grey. Cryo-EM density overlaid in grey. d, SpCas9-based editing of HEK293T cells in the absence (grey bar, dashed line) or presence of designed binders (green bars) or natural Acrs (blue bars). e, Structural architecture of Clostidium butyricum Argonaute with bound gDNA and tDNA (PDB 6QZK). The PAZ domain and N + PIWI domains used as design targets are highlighted in light and dark blue. f, CbAgo-gDNA-mediated cleavage of target DNA in the absence (grey bar, dashed line) or presence of designed binders (green bars) or designed SpCas9 binders (blue bars). Bar plots represent the mean of n = 3 replicates, with standard deviation indicated by error bars. g, CbAgo-gDNA-mediated cleavage of target DNA in absence of binders (grey line) or in presence of designed binder2 (pink line) or binder3 (purple line). Plotted points represent an average of three measurements with standard deviation indicated by error bars.
Fig. 5
Fig. 5. Engineering targeted gene delivery by AAV.
a, Schematic representation illustrating AAV-cmv-GFP retargeting on genetic insertion of a cell-type receptor-specific miniprotein binder, replacing the natural primary attachment to cell-surface glycans. b, Chimeric assembly of a retargeted AAV particle, composed of the capsid proteins with (pink) and without (green) inserted binder in a defined stoichiometric ratio. c, Transduction efficiency measured by flow cytometry of different AAV variants targeting HER2 or PD-L1, determined after transfer of packaging cell supernatant onto HEK293 cells stably overexpressing the respective target receptors. The signal-to-noise ratio, defined as target/non-target ratio between the transduction rates measured on each cell line, is indicated as ‘×’ fold change. For comparison, each of the two cell lines is similarly transduced with the wild-type AAV6-cmv-GFP (WT) and the AAV capsid variant carrying knockout (KO) mutations. Transduction efficiencies were measured in triplicates (n = 3) and error bars indicate a 95% confidence interval. d, Design model of binder1 against HER2. e, Design model of binder202 against PD-L1. f, Heatmap of the transduction rates at a normalized multiplicity of infection (MOI) of 1 × 105 vg per cell of the AAV variants carrying the binder1 against HER2 and binder202 against PD-L1, as well as the KO and WT controls, on HEK293 cells stably overexpressing the respective target receptors. g, Transduction with the PD-L1-targeting AAV carrying the binder202. The lower histogram shows that an anti-PD-L1 antibody, which targets the binding site of AAV-binder202, blocks the transduction of HEK293 cells stably overexpressing PD-L1. Panel a was created using BioRender (https://biorender.com).
Extended Data Fig. 1
Extended Data Fig. 1. In silico analysis of BindCraft designs.
a, Graphs plotting the RMSD of the target structure after initial AF2 binder hallucination, compared to the input target structure for different design targets. b, Effect of the helicity loss on secondary structure content of binders designed against PD-L1. Negative values that discourage the formation of alpha-helices can result in purely beta-sheeted binders. c, Number of GPU hours elapsed to generate 100 binder designs passing computational filters across different binder lengths and targets. Numbers above bars indicate the number of designs that needed to be sampled. Filtering conditions for BindCraft and RFdiffusion are described in Methods. d, Amino acid type distribution at the designed binder interfaces generated by BindCraft and RFdiffusion averaged across four different targets. e, Comparison of maximum TM-scores and sequence identities of designed binder folds and designed binder–target interfaces against their closest matches in the PDB. Binder folds (green) were assessed using Foldseek, and interfaces (pink) were evaluated using PPIref and USalign. For depicted box plots, the centre line represents the median of the data (50th percentile) and the box spans the 25th and 75th percentiles of the data. The whiskers show the minimum and maximum values of the distribution. Outliers (circles) are data points that fall outside the 1.5 interquartile range.
Extended Data Fig. 2
Extended Data Fig. 2. Experimental characterization of binding modes of binders targeting cellular receptors.
a, Competition assay showing that the anti-PD-1 antibody, pembrolizumab, occupies the same binding site on PD1 as binder2. b, SEC-MALS analysis of PD-L1_b4 alone (left) and in complex with PD-L1-Fc (right). c, Competition assay showing previously published de novo binder DBL2_04 occupying the same binding site as PD-L1 binder4. d, Structural overlay highlighting the binding mode of PD1 (grey) versus PD-L1_b4 (salmon). e, SEC-MALS analysis of IFNAR2_b5. f, Competition assay displaying the natural IFNA2 binding partner occupies an overlapping binding site with IFNAR2 binder5. g, Structural overlay highlighting the binding of mode of IFNA2 (grey) versus IFNAR2_b5 (salmon). h, Specificity of three selected binders against PD-L1, IFNAR2, and PD-1, as assessed by BLI at 1 µM. i_pTM values are shown for each binder-target interaction (green: on-target; black: off-target). i Structural overview of the binding mode of CLDN1 binder12 (salmon) and the native CpE toxin interaction partner (grey).
Extended Data Fig. 3
Extended Data Fig. 3. Targeting natural and de novo binding epitopes.
a, Design model of binder4 in complex with de novo designed beta-barrel BBF-14. b, Single cycle kinetic analysis with SPR of binder4 binding to BBF-14. c, Comparison of crystal structure (coloured) of the BBF-14_binder4 complex overlaid with the design model (grey). d, Refined 2mFo − mFc electron density map of the BBF-14_binder4 complex rendered in gray and contoured at 1.0σ. The model complex refined against the map is shown as cartoon representation with BBF-14 coloured green and binder4 in salmon. e, Design model of binder4 binding to the challenging structural protein target SAS-6. f, SPR binding traces of binder4 to CrSAS-6 monomeric form. g, SPR binding traces of binder4 to CrSAS-6 dimeric form. h, Structural model of the oligomeric form of SAS-6 with binder4 (salmon) overlaid with the previously characterized monobody MBCRS6-1.
Extended Data Fig. 4
Extended Data Fig. 4. Biophysical and structural properties of binders targeting allergens.
Refined 2mFo − mFc electron density map of the Der f7_binder2 complex rendered in grey and contoured at 1.0σ for crystal form P21 in a and the crystal form C121 in b. The model complex refined against the map is shown as cartoon representation with Der f7 coloured green and binder2 in salmon. c, SEC-MALS analysis of Der f7_binder2. d, SEC-MALS analysis of Der f21_binder10 e, Refined 2mFo − mFc electron density map of the Der f21_binder10 complex rendered in grey and contoured at 1.0σ. The model complex refined against the map is shown as cartoon representation with Der f21 coloured green and binder10 in salmon. f, SEC-MALS analysis of Bet v1_binder2. g, Specificity of three selected binders against Der f7, Der f21, and Bet v1, as assessed by SPR with increasing concentrations (4.6–10 µM). i_pTM values are shown for each binder-target interaction (green: on-target; black: off-target).
Extended Data Fig. 5
Extended Data Fig. 5. Biophysical and structural analysis of binders against nucleic acid-guided nucleases.
a, Representative 2D class averages of apo SpCas9 (left), SpCas9 bound to binder3 (centre) and binder10 (right). b, Views of the unsharpened cryo-EM density maps coloured by local resolution. Predicted model of the apo conformation of SpCas9 with bound c, binder3 or d, binder10 docked into its respective cryoEM density. e, Representative BLI sensorgram displaying binding kinetics of CbAgo and binder2. f, Size exclusion chromatography (SEC) analysis of CbAgo only (grey line) or binder2 only (orange line) or combined (green line). g, SEC analysis of CbAgo only (grey line) or in presence of gDNA (orange line) or in presence of both gDNA and binder2 (blue line). h, Structural comparison of the binder2 overlaid with the target DNA-bound structure of CbAgo, indicating overlapping binding sites.
Extended Data Fig. 6
Extended Data Fig. 6. Screening of functional cell-type specific AAVs.
a, Schematic illustrating the small-scale screening assay. Both the production cell line as well as the target cells overexpressing the target receptors are derived from the same parent cell line, allowing to directly transfer the supernatant of AAV-packaging cells onto the targeted cells for transduction. The right scatter plot illustrates the transduction signal measured by flow cytometry (GFP expression) b, Supernatant viral titres (log-scale) of the different AAV variants screened (Fig. 5c), as indicated. Titres were measured in duplicates (n = 2) and error bars indicate 95% confidence interval. c, Receptor expression levels of the created stable cell lines for screening, stained by APC-conjugated antibodies. Panel a was created using BioRender (https://biorender.com).
Extended Data Fig. 7
Extended Data Fig. 7. Benchmarking prediction accuracy across design pipelines.
Experimentally validated binders and non-binders from previously published binder design pipelines have been repredicted using the BindCraft prediction pipeline with either AF2 a, monomer (default) or b, multimer models. Of note, EvoPro and RFdiff designs have been already prefiltered by AF2 monomer in their respective publications, and indicate the presence of false positives. RIFdock and Masif-seed, designs were not prefiltered by AF2. The centre line in box plots represents the median of the data (50th percentile), the box spans the 25th and 75th percentiles of the data. The whiskers show the minimum and maximum values of the distribution. Outliers (circles) are data points that fall outside the 1.5 interquartile range. c, The i_pTM values of AlphaFold2 and AlphaFold3 predictions of experimentally characterized BindCraft designs.

Update of

  • BindCraft: one-shot design of functional protein binders.
    Pacesa M, Nickel L, Schellhaas C, Schmidt J, Pyatova E, Kissling L, Barendse P, Choudhury J, Kapoor S, Alcaraz-Serna A, Cho Y, Ghamary KH, Vinué L, Yachnin BJ, Wollacott AM, Buckley S, Westphal AH, Lindhoud S, Georgeon S, Goverde CA, Hatzopoulos GN, Gönczy P, Muller YD, Schwank G, Swarts DC, Vecchio AJ, Schneider BL, Ovchinnikov S, Correia BE. Pacesa M, et al. bioRxiv [Preprint]. 2025 Apr 25:2024.09.30.615802. doi: 10.1101/2024.09.30.615802. bioRxiv. 2025. Update in: Nature. 2025 Oct;646(8084):483-492. doi: 10.1038/s41586-025-09429-6. PMID: 39677777 Free PMC article. Updated. Preprint.

References

    1. Jumper, J. et al. Highly accurate protein structure prediction with AlphaFold. Nature596, 583–589 (2021). - PMC - PubMed
    1. Cao, L. et al. Design of protein-binding proteins from the target structure alone. Nature605, 551–560 (2022). - PMC - PubMed
    1. Gainza, P. et al. De novo design of protein interactions with learned surface fingerprints. Nature617, 176–184 (2023). - PMC - PubMed
    1. Bennett, N. R. et al. Improving de novo protein binder design with deep learning. Nat. Commun.14, 2625 (2023). - PMC - PubMed
    1. Watson, J. L. et al. De novo design of protein structure and function with RFdiffusion. Nature620, 1089–1100 (2023). - PMC - PubMed

LinkOut - more resources