. 2025 Oct;646(8083):161-170.
doi: 10.1038/s41586-025-09419-8. Epub 2025 Aug 27.

Maternal stress triggers early-life eczema through fetal mast cell programming

Affiliations

Maternal stress triggers early-life eczema through fetal mast cell programming

Nadine Serhan et al. Nature. 2025 Oct.

Abstract

Prenatal stress (PS) is a repeated exposure to aversive situations during pregnancy, including high emotional strain, which is suspected to affect homeostatic systems in infants. Paediatric eczema develops quickly after birth at flexural sites subjected to continuous mechanical constraints1,2. Although epidemiological studies have suggested an association between PS and a higher risk of eczema in children3-6, no causative biological link has yet been identified. Here we show that eczema at birth originates from molecular dysregulations of neuroimmune circuits in utero, triggered by fluctuations in the maternal hypothalamic-pituitary-adrenal axis. We found that offspring of stressed pregnant dams have dysregulated mast cells and skin-projecting neurons and quickly develop eczema in response to harmless mechanical friction. We demonstrated that PS transiently modulates amniotic fluid corticosterone concentrations, which directly alters the activation program of skin mast cells expressing the glucocorticoid receptor Nr3c1 and the adjacent sensory neurons conveying mechanosensation. Therapeutic normalization of maternal corticosterone concentrations or genetic depletion of Mcpt5+ mast cells during stressed gestation prevents fetal immune dysregulation and protects against eczema development after birth. Our findings support a new model in which early-onset paediatric eczema originates from dysregulations in the fetal immune system, caused by fluctuations in maternal glucocorticoids induced by stress.


Conflict of interest statement

Competing interests: N. Gaudenzio is (or was) collaborating, consulting or serving as a member of the scientific advisory board for Genoskin (where he is CSO and a shareholder), Escient pharmaceuticals, Aikium, CEVA, MaxiVAX, Boehringer Ingelheim, Novartis, Sanofi, Allegria and argenx. L.R. is (or was) collaborating or consulting for Neovacs, Novartis, CEVA and argenx. The other authors declare no competing interests.

Figures

Fig. 1
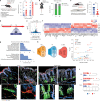
Fig. 1. Mild mechanical trigger drives the development of skin inflammation in PS offspring.
a, Timed-pregnant dams were restrained under a bright light for 30 min, 3 times a day and from E13 to E18. P0, parturition. b,c, Representative photographs and haematoxylin and eosin (H&E) staining of back skin sections from CT and PS W8 offspring (b) and epidermal thickness (in µm; n = 10; c). d, Baseline TEWL measurements (in g m−2 h−1; n = 11). e, Serum cytokine concentrations (in pg ml−1) in CT (n = 7) and PS (n = 6) W8 offspring at steady state. f, Mild mechanical skin injury protocol (tape stripping (T/S)). Skin injury was induced by low repeats of tape stripping. g,h, Representative photographs and H&E staining of CT and PS back skin sections from T/S (n = 7 (CT) and 10 (PS)) and mock W8 (n = 5 (CT) and 9 (PS)) offspring (g) and epidermal thickness (in µm; h). i, Back skin of CT (n = 15) and PS (n = 17) W8 offspring was patched with PBS-filled gauze pads occluded in a dressing to favour innocuous mechanical trigger. j,k, Representative photographs and H&E staining of CT and PS back skin sections from Stim. W8 offspring (j) and epidermal thickness (in µm; n = 8; k). l, Spleen weight (in mg; n = 14 (CT) and 17 (PS)). m, IgE serum titres (in ng ml−1; n = 18 (CT and CT PBS) and 22 (PS and PS PBS)). Data were obtained from at least three independent experiments. Bars represent mean values, and one dot or square corresponds to a single male or female mouse. Mean + s.e.m.; *P < 0.05; **P < 0.01; Mann–Whitney U-test (ce,h,k,l); ordinary one-way analysis of variance (ANOVA) for multiple comparisons using Šidák correction (h (F = 12.30; P < 0.0001), m (F = 2.621; P = 0.0568)); two-sided. IgE, immunoglobulin E; NS, nonsignificant; stim., mechanical stimulation. Scale bars, 50 µm (b,g), 20 µm (j). Illustrations in f and i were created using BioRender (https://biorender.com). Source Data
Fig. 2
Fig. 2. Early-life stress enhances mechanical sensitivity in adult offspring through perturbation of sensory neurons involved in skin mechanical sensation.
a, Mechanical alloknesis test and alloknesis scores in W8 CT and PS (n = 15) offspring. b, Sticky-tape assay and success rate in CT versus PS groups (n = 15). c, von Frey filament test and thresholds (in g) of CT (n = 10) and PS (n = 13) W8 offspring. d, DRG from CT and PS offspring (n = 3) were collected at W8 and bulk RNA sequenced. e, Volcano plot of the significantly upregulated (red) and downregulated (green) DEGs in PS W8 offspring. Minimum fold change greater than 1.25 and Padj < 0.05. f, Heat map of the top 50 DEGs between the DRG neurons of PS and CT W8 offspring. g, Gene ontology terms enriched in DRG of PS W8 offspring (top and bottom panels for upregulated and downregulated genes, respectively). h, Suggested markers for the identification of PEP, non-peptidergic (NP) and c-LTMRs (left panel). Volcano plot representing specific genes of PEP (orange), NP (blue) neurons and c-LTMRs (red) DEGs in PS W8 offspring (right panel). i,j, Representative confocal microscopy images of Tubβ3 (green; n = 8 (CT) and 7 (PS)), TH (red; n = 8) and IB4 (blue; n = 6) (i) and filament length (in µm; j) in hair follicles in back skin sections of W8 CT and PS offspring. Data were obtained from two or three independent experiments. Bars represent mean values, and each dot or square corresponds to a single mouse (a,c,j). Mean + s.e.m.; *P < 0.05, **P < 0.01 and ***P < 0.001; two-way ANOVA with multiple comparisons using Šidák corrections (a (P < 0.0001; F = 44.34)), Fisher’s exact test (b) and Mann–Whitney U-test (c,j), two-sided. Scale bars, 20 µm (i (top)), 7 µm (i (bottom)). GO, gene ontology. Illustrations in ac were created using BioRender (https://biorender.com). Source Data
Fig. 3
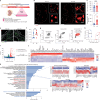
Fig. 3. Mast cells in PS offspring are dysregulated and required for the development of skin inflammation.
a, Single-cell RNA sequencing of W8 and W24 (n = 3) CD45+ immune cells from back skin. b, Uniform Manifold Approximation and Projection (UMAP) plot and cell annotation of CT and PS, W8 and W24 aggregates. c, Heat map of main canonical marker expression. d, Number of DEGs in PS compared with CT W8 offspring. e, Top-enriched genes in mast cells. f, Representative confocal microscopy images of avidin SRho+ mast cells (red) in the back skin of W8 CT and PS offspring. g, Mast cell (MC) counts per square millimetre (n = 7 (CT) and 9 (PS)). h, Gene ontology terms enriched in PS W8 mast cells. i, Mating pairs were designed as follows: KitWsh/Wsh females with KitWsh/Wsh males and iDTAfl/fl females with Mcpt5-cre+ males. jm, Representative photographs and H&E staining of CT and PS back skin sections from W8 stim. KitWsh/Wsh and Mcpt5-cre+/−;iDTAfl/fl mice and littermate CTs (j,l) and epidermal thickness (in µm; n = 7 (CT KitWsh/Wsh), 10 (PS KitWsh/Wsh), 7 (CT Mcpt5-cre−/−;iDTAfl/fl), 3 (CT Mcpt5-cre+/−;iDTAfl/fl), 11 (PS Mcpt5-cre−/−;iDTAfl/fl) and 13 (PS Mcpt5-cre+/−;iDTAfl/fl)) (k,m). n, Heat map of the top 100 W8 DEGs and normalized gene expression. o, Representative confocal microscopy images of avidin SRho+ mast cells (red) in the back skin of W24 CT and PS offspring. p, MC counts per square millimetre (n = 3 (CT) and 7 (PS)). Dotted blue and red lines indicate mean counts in CT and PS W8 offspring, respectively. Data were obtained from three independent experiments. Each dot or square corresponds to a single mouse (g,k,m,p). Mean + s.e.m.; *P < 0.05 and ***P < 0.001; Mann–Whitney U-test (g,k,p), Kruskal–Wallis test for multiple comparison using Dunn’s correction (m), two-sided. dDC, dermal dendritic cells; ILC, innate lymphoid cells; LC, Langerhans cells; MC, mast cells; NK, natural killer; SS, steady state. Scale bars, 30 µm (f,o), 20 µm (j,l). Illustrations in a were created using BioRender (https://biorender.com). Source Data
Fig. 4
Fig. 4. Fetal mast cells are already dysregulated in utero after stress exposure and exhibit a hyper-activated phenotype.
af, Fetal skin from E18.5 embryos was collected (a) and analysed using confocal microscopy (bf). gk, Fetal mast cells were then sorted and analysed using bulk RNA-seq. b, Representative microscopy images of avidin SRho+ mast cells in whole embryo sagittal section (left) and 3D back skin (right) in CT and PS E18.5 offspring. c,d, Total (c) and degranulated (d) mast cell counts per square millimetre of back skin (n = 7). e,f, Representative 3D confocal microscopy images of Tubβ3 staining (green) in fetal skin of CT and PS E18.5 offspring (e) and associated filament length (in µm; n = 5 (CT) and 6 (PS); f). Data were obtained from three independent experiments. Bars represent mean values, and each dot corresponds to a single mouse (c,d,f). Mean + s.e.m.; **P < 0.01; Mann–Whitney U-test (c,d,f), two-sided. g, Fetal mast cell sorting strategy. h, PCA of bulk RNA-seq of mast cells from CT and PS E18.5 offspring (n = 3 pools of four embryos). i, Volcano plot of the significantly upregulated (red) and downregulated (green) DEGs in PS E18.5 offspring. j, Heat map of the top 50 DEGs between the mast cells of CT and PS E18.5 offspring. k, Gene ontology terms enriched in mast cells from PS versus CT (blue, related to mast cell biology; red, related to response to glucocorticoid). The left upper panel is for upregulated genes, whereas the left lower panel is for downregulated genes. Examples of genes enriched in PS mast cells related to granule formation, remodelling, maturation and activation are shown in the right panels. Fc, fragment crystallizable. Scale bars, 2 mm (b (left)), 30 μm (b (upper right)), 10 μm (b (lower right)), 50 μm (e). Source Data
Fig. 5
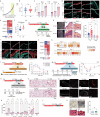
Fig. 5. Corticosterone directly activates fetal mast cells in vitro and promotes a pro-inflammatory microenvironment.
a,b, UMAP (a) and feature plot (b) in E13.5, E14.5, P0, P2 and P4 aggregates. Dotted lines define the mast cell and macrophages populations. c,d, Expression levels at E13.5 (c) or during development (d). e, Heat map of top-enriched genes. f, Corticosterone concentrations (in ng ml−1) in amniotic fluid (AF) (n = 8 (CT) and 9 (PS)) and serum (n = 10 (CT) and 8 (PS)). g, Heat map of cytokines significantly enriched in AF. h, Single-cell analysis of mast cell degranulation. i,j, Representative confocal microscopy pictures of avidin SRho staining (left) and associated MFI (right) (n = 476 (Tyrode), 335 (substance P (SP)), 651 (Tyrode–chloroform), 475 (corticosterone (CORT)), 353 (AF CT) and 361 (AF PS)) of fetal mast cells after stimulation with classical stimuli (i), corticosterone or amniotic fluids (j). k, Metyrapone (Met) treatment. l, Corticosterone concentrations (in ng ml−1) in dams serum (n = 13 (CT and PS), 12 (CT-Met) and 10 (PS-Met)). m, Heat map of AF cytokine concentrations. Upper rows show average values from g. n, Representative photographs and H&E after stim. and epidermal thickness (in µm; n = 8 (CT-Met) and 10 (PS-Met)). o, von Frey thresholds (n = 9 (CT-Met) and 15 (PS-Met)). p, Representative confocal microscopy images of avidin SRho in back skin. Counts per square millimetre at E18.5 (n = 4 (CT-Met) and 12 (PS-Met)) and W8 (n = 5 (CT-Met) and 11 (PS-Met)). q, Representative confocal microscopy pictures of avidin SRho and MFI (n = 771 (AF CT-Met) and 752 (AF PS-Met)). Blue and red lines indicate mean CT and PS values (o,p) or AF CT and AF PS values (q), respectively. Data were obtained from at least three independent experiments. Bars represent mean values. Each dot represents one mouse (f,l,np) or one mast cell (i,j,q). Mean + s.e.m.; *P < 0.05, **P < 0.01 and ***P < 0.001; Mann–Whitney U-test (f,i,j,nq) and Kruskal–Wallis test for multiple comparison (Dunn’s correction; l), two-sided. Scale bars, 5 µm (i,j,q), 25 µm (n), 10 µm (p). Source Data
Extended Data Fig. 1
Extended Data Fig. 1. PS-associated inflammation differs from antigen-mediated atopic dermatitis.
a, Dams weight follow-up (n = 22 [CT], 18 [PS]). b, Litter size (n = 25 [CT], 29 [PS]). c, Weight of W1 (n = 6 M/8 F [CT], 6 M/16 F [PS]), W2 (n = 6 M/8 F [CT], 6 M/16 F [PS]), W4 (n = 6 M/6 F [CT], 6 M/16 F [PS]) offspring. d,e, Representative confocal microscopy images of W8 skin (d) and MFI (e). f, Baseline TEWL (g/m2/h; n = 13 [CT], 7 [PS]). g, Tape-stripping protocol (T/S). h, Representative photographs and H&E in W3 skin, epidermal thickness (µm, CT [n = 10], PS [n = 9]). i,j, Representative confocal microscopy images of Stim. W8 skin (i) and MFI (j). k, Relative expression in Stim. W8 skin. Numbers indicate p values. l, Passive cutaneous anaphylaxis. Changes in ear thickness (mm, [n = 6]). m, Peanut-induced anaphylaxis. Changes in temperature (°C, [n = 7 (CT), 9 (PS)]). n, Asthma model. o, Representative H&E of W8 lung. p, Representative confocal microscopy images of α-smooth muscle actin (αSMA) in W8 lungs. q, Cell counts (/mg of lung, [n = 5]). r, Mechanical stimulation (Stim.). s, Representative photographs and H&E of Stim. W24 skin and epidermal thickness (µm; n = 4 [CT], 12 [PS]). Data are from at least two/three independent experiments. Bars represent mean values. Each dot represents one mouse (b, c, f, h, q-s). Scale bars: 20 µm (d, i), 25 µm (h), 200 µm (o), 1 mm (cropped to 100 µm, p), 50 µm (s). Mean + SEM; *P < 0.05, **P < 0.01, ***P < 0.001, ns: not significant; Mann-Whitney test (b, c, f, s), Kruskal Wallis test for multiple comparisons (Dunn’s correction [h, q]), 2-way ANOVA with multiple comparisons (Šidák correction, l [P = 0.0003, F = 10.30]), m [P = 0.5679, F = 0.342], r [P = 0.0001, F = 22.45]), two-sided. Illustrations in l,m,n were created using BioRender (https://biorender.com). Source Data
Extended Data Fig. 2
Extended Data Fig. 2. Sensory neurons are disrupted in the dorsal root ganglia and the glabrous skin of PS offspring.
a, Cumulative time spent not responding to the tape (no-response time, seconds). b,c, Averaged time courses ± SEM of tape-directed bouts (b) and AUC (c) of CT (n = 8 M/7 F) and PS (n = 9 M/6 F) offspring. d, Ex vivo DRG neuron stimulation and calcium imaging. Percentage (%) of responsive neurons. e-g, Traces of the calcium-induced changes of fluorescence exclusively in responding neurons after addition of capsaicine (e, n = 35 [CT], 21 [PS]), b-alanine (f, n = 97 [CT], 57 [PS]) and MRS2365 (g, n = 87 [CT], 131 [PS]), and amplitude of the neuronal response measured as AUC of the highlighted duration (for 20 s after the addition of the stimulus), normalized per cell (upper panel) or per experiment (lower panel). Each triangle is a responding neuron, and each dot represents an experiment including 2 mice per group (d-g). h-j, Representative confocal microscopy images of neurofilament H (NFH, h) and GDNF Family Receptor Alpha 2 (Gfrα2, i) in glabrous skin sections and filament length (µm, j) per mm2 in steady state W8 CT (n = 6) and PS (n = 7) offspring. Scale bars, 30 µm (cropped to 7 µm). k,l, Representative confocal microscopy images of Tubβ3, TH, IB4 and Substance P staining (k) and associated percentages (l) among all Tdt+ neurons, in DRG from Nav1.8-Cre+;Tdt CT (n = 6) and PS (n = 6 [TH+], 7 [IB4+, SP+]) at steady state. Scale bars, 200 µm (cropped to 30 µm). Data are from at least two or three independent experiments. Bars represent mean values, and each dot or square corresponds to a single mouse (a,j,l). Mean + SEM; *P < 0.05, **P < 0.01, ***P < 0.001, ns: not significant; Unpaired t-test (a, c), Mann-Whitney test (d-g, j, l), two-sided. Illustrations in d were created using BioRender (https://biorender.com). Source Data
Extended Data Fig. 3
Extended Data Fig. 3. Sensory neurons are not required for inflammation onset in PS offspring.
a, Resiniferatoxin treatment. W4 offspring was subcutaneously injected with increasing resiniferatoxin (RTX) doses of 30 μg/kg, 70 μg/kg and 100 μg/kg for three consecutive days. 4 weeks later, denervation was assessed using the classical tail flick assay, and a mild model of skin damage (T/S) was conducted. b, Tail flick latency (s) for CT and PS (n = 9 [DMSO], 10 [RTX]) offspring. c, Representative H&E staining and corresponding epidermal thickness (µm) of CT and PS (n = 4 [DMSO], 5 [RTX]) back skin sections of W8 offspring. Scale bar, 25 µm. d, Representative H&E staining and corresponding epidermal thickness (µm) of CT (n = 6 [Nav1.8-Cre-;DTAfl/fl], 8 [Nav1.8-Cre+;DTAfl/fl]) and PS (n = 5 [Nav1.8-Cre-;DTAfl/fl], 9 [Nav1.8-Cre+;DTAfl/fl]) back skin sections of W8 offspring. Scale bar, 25 µm. e, Peripheral chemical sympathectomy. W8 offspring were intraperitoneally injected with the neurotoxin 6-hydroxydopamine (6-OHDA, 150 mg/kg). f, Von Frey thresholds (g). g,h, Representative confocal microscopy images of Tyrosine Hydroxylase (TH, red) (g) and associated filament length (µm, h) in back skin sections of 6-OHDA-treated W8 CT (n = 7) and PS (n = 9) offspring. Scale bars: 50 µm (cropped to 20 µm). Data are from one or two independent experiments. Bars represent mean values, and each dot, triangle or square corresponds to a single mouse (c, d, f, h). Mean + SEM; *P < 0.05, **P < 0.01, ***P < 0.001; Kruskal Wallis test for multiple comparisons with Dunn’s correction (b-d), Mann-Whitney test (f, h), two-sided. Source Data
Extended Data Fig. 4
Extended Data Fig. 4. Prenatal stress offspring show normal proportions of skin-resident immune cells at steady state.
a, Back skin of CT and PS W8 offspring was collected and dissociated using mechanical and enzymatic digestion. Immune phenotyping was then conducted using flow cytometry. b-e, Gating strategies of lymphoid (b) and myeloid (c) populations and corresponding cell proportions (d,e; n = 7). f, Enrichment of immune cells and sorting strategy. g, W8 and W24 immune cells transcriptome (n = 27,501) visualized with UMAP, colored according to unsupervised Seurat clustering. h, Heatmap of expression of the main canonical markers used for identification of Seurat clusters. Data are from two independent experiments. Source Data
Extended Data Fig. 5
Extended Data Fig. 5. Prenatal stress alters yolk sac-derived mast cells and induces transient epigenomic changes.
a,b, Representative confocal microscopy images of Avidin SRho+ mast cells in back skin of pregnant dams (n = 7, a), Mcpt5-Cre+/-;iDTAfl/fl (n = 12 [Mcpt5-Cre-/-;iDTAfl/fl], 13 [Mcpt5-Cre+/-;iDTAfl/fl], b), and counts per mm2. Scale bars, 100 µm (cropped to 15 µm, a) and 30 µm (b). c, Von Frey thresholds (n = 11 [PS Mcpt5-Cre-/-;iDTAfl/fl], 14 [PS Mcpt5-Cre+/-;iDTAfl/fl]). d, Representative confocal microscopy images and filament length (µm) of Tubβ3 (n = 8 [Cre-], 12 [Cre+]), TH (n = 6 [Cre-], 9 [Cre+]) and IB4 (n = 4 [Cre-], 8 [Cre+]) in PS back skin sections. Scale bars: 50 µm (cropped to 10 µm). e, Quantification of filament length per mm2 of skin. f, Single nuclei Multiome ATAC seq. g, UMAP plot of W8 and W24 ATACseq aggregate and cell annotation. h, Heatmap of main canonical markers expression. i, Number of differentially accessible chromatin regions (DARs). j, Fate mapping. k-m, Representative confocal microscopy images of Avidin SRho+ mast cells and GFP (k), percentages (%) of mG (GFP)+ mast cells among total mast cells (l) and degranulated mast cells (m), in fetal back skin of PS offspring, fate-mapped at E7.5 (n = 8) or E10.5 (n = 12). Scale bars, 50 µm (cropped to 20 µm). n,o, Representative confocal microscopy images of Avidin+ mast cells and Tdt (n) and percentages (%) of Tdt+ mast cells among total mast cells (o), in back skin of CT Cdh5-CreERT2+/-;Tdt W8 (n = 5) and W24 (6) offspring, fate-mapped at E7.5. Scale bars, 50 µm (cropped to 20 µm). Arrows indicate YS-derived mast cells (k, n). Data are from at least two or three independent experiments. Bars represent mean values, and each dot/square corresponds to a single mouse (a-d, m, o). Mean + SEM; **P < 0.01, ***P < 0.001, ns: not significant; Mann-Whitney test (a-d, m, o), two-sided. Source Data
Extended Data Fig. 6
Extended Data Fig. 6. Impact of corticosterone on offspring in different models.
a, UMAP plot of E12.5, E15.5, P0, P5 and adult DRG scRNAseq. b, Expression levels. c,d, Corticosterone levels (ng/ml) in dams serum (c), W2 (n = 8 [CT], 6 [PS]), W8 (n = 10 [CT], 8 [PS]) and W24 (n = 4 [CT], 5 [PS]) offspring (d). e, Representative pictures of DRG neurons. Percentage (%) of responsive neurons. f, Weight follow-up of dams (n = 8) and litter size (n = 10, [upper]). Weight of male (n = 10 [CT], 7 [CT-Met], 10 [PS], 11 [PS-Met]) and female (n = 8 [CT], 12 [CT-Met], 18 [PS/PS-Met]) offspring (lower). g, Representative confocal microscopy images in W8 back skin. Scale bars, 50 µm (cropped to 10 µm). h, Filament length (µm) per mm2, of Tubβ3+ (n = 5 [CT], 9 [PS]), TH+ (n = 5 [CT], 10 [PS]) or Tubβ3+ IB4+ neurons (n = 5 [CT], 10 [PS]). i, Percentage (%) of responsive neurons. j, Corticosterone levels (ng/ml, n = 8). k, Representative confocal microscopy images of CD45 and AvidinSRho staining in back skin. Scale bars, 50 µm (cropped to 10 µm). Counts of CD45+ immune cells, total and degranulated mast cells per mm2 (n = 4 [WT], 7 [AdKOv2]). Data are from at least three independent experiments. Bars represent mean values. Each dot/square corresponds to a single mouse (d, f, h, j, k) or one experiment (2 mice/experiment, e, i). Dotted blue/red lines indicate the mean percentage from CT/PS, respectively. Mean + SEM; *P < 0.05, **P < 0.01, ***P < 0.001, ns: not significant; 2-way ANOVA for multiple comparisons using Šidák correction (c [P = 0.0022, F = 15.00], f [upper left, P = 0.2029, F = 1.785]), Mann-Whitney test (d, f [upper right], h, j, k), Kruskal Wallis for multiple comparison with Dunn’s correction (e, f [lower]), two-sided. Source Data
Extended Data Fig. 7
Extended Data Fig. 7. Atopic pregnant women exhibit significantly higher circulating levels of cortisol than non-atopic pregnant women during the gestational period.
a, UMAP plot of the publicly available scRNAseq dataset for human fetal DRG performed at gestational week (GW)7-10, 12, 14, 15, 17 and 20. b, Feature plot of the expression of NR3C1 and ADRB2. c, Expression levels of NR3C1 and ADRB2 in neural crest cells, sensory neuron progenitors and nociceptors during development. d, UMAP plot of the publicly available scRNAseq dataset for human skin performed at GW 7.5, 10, 12.5, 15 and 17. e, Feature plot of the expression of NR3C1 and ADRB2. f, Expression levels of NR3C1 and ADRB2 in macrophages (blue) and mast cells (purple) during development. g, Description of the study cohort, including demographic and clinical characteristics, immune sensitization status (non atopic: NA, atopic: R), and cortisol levels. h-j, Cortisol levels (ng/ml) at GW6-10 (h, n = 16 [NR], 11 [R]) and during delivery (i, n = 17 [NR], 8 [R]), and associated averages (j). Mean + SEM; *P < 0.05, ns: not significant; Mann-Whitney test (h, i), two-sided. Illustration in g was created using BioRender (https://biorender.com). Source Data
Extended Data Fig. 8
Extended Data Fig. 8. Summary scheme.
Activation of the HPA axis in pregnant dams upon exposure to chronic stress leads to increase in corticosterone-enriched and inflammatory in utero environment (1), which subsequently disrupts the development of long-lived yolk sac (YS)-derived fetal skin mast cells (2). At birth, the dysregulation of the mast cell transcriptomic/epigenetic program (3) and the modifications in the transcriptomic, functional and anatomical features of sensory neurons (4) altogether contribute to the mechanical hyper-reactivity of the skin (5). Upon exposure to innocuous mechanical trigger (i.e. mild wet friction), the offspring develops severe eczematous lesions (5) that resolve with age, after the natural replacement of imprinted YS-derived mast cells (6). Schematic was created using BioRender (https://biorender.com).

References

    1. Langan, S. M., Irvine, A. D. & Weidinger, S. Atopic dermatitis. Lancet396, 345–360 (2020). - PubMed
    1. Bieber, T. et al. Clinical phenotypes and endophenotypes of atopic dermatitis: where are we, and where should we go? J. Allergy Clin. Immunol.139, S58–S64 (2017). - PubMed
    1. Smejda, K. et al. Maternal stress during pregnancy and allergic diseases in children during the first year of life. Respir. Care63, 70–76 (2018). - PubMed
    1. Larsen, A. D. et al. Exposure to psychosocial job strain during pregnancy and odds of asthma and atopic dermatitis among 7-year old children—a prospective cohort study. Scand. J. Work Environ. Health40, 639–648 (2014). - PubMed
    1. Letourneau, N. L. et al. Maternal sensitivity and social support protect against childhood atopic dermatitis. Allergy Asthma Clin. Immunol.13, 26 (2017). - PMC - PubMed

MeSH terms

LinkOut - more resources