. 2025 Aug 27;26(1):495.
doi: 10.1186/s12882-025-04398-4.

Global, regional, and national burden of chronic kidney disease and its associated anemia, 1990 to 2021 and predictions to 2050: an analysis of the global burden of disease study 2021

Affiliations

Global, regional, and national burden of chronic kidney disease and its associated anemia, 1990 to 2021 and predictions to 2050: an analysis of the global burden of disease study 2021

Qiao Qi et al. BMC Nephrol. .

Abstract

Background: Our objective was to conduct a thorough evaluation of the burden of CKD and its associated anemia by age and sex at the global, regional, and national levels, with projections extending to 2050.

Methods: The data from the Global Burden of Diseases (GBD) 2021 were used to describe relevant indicators of CKD and its associated anemia. At different geographic levels, subgroup analysis was carried out by sex, age, and Socio-Demographic Index (SDI). The time trend was examined using the joinpoint regression and decomposition analyses, and predictive analysis was utilized to further estimate the disease burden to 2050.

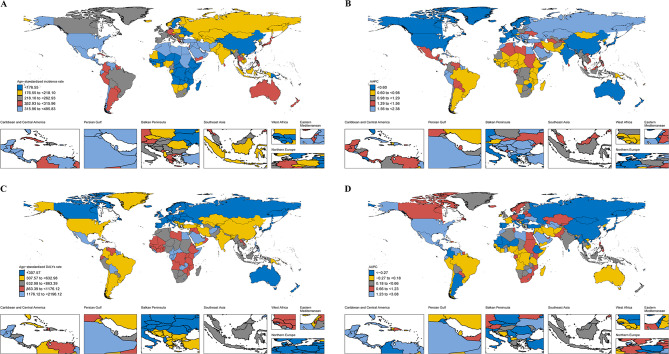
Results: The incidence, prevalence, mortality, and Disability-Adjusted Life Years (DALYs) of CKD, along with the prevalence and Years Lived with Disability (YLDs) of CKD-associated anemia, maintained a steady increase and would continue until 2050. In addition, the ASRs of mortality and DALYs attributable to CKD in 2021 were highest in low SDI regions. Regionally, CKD exhibited the greatest ASRs of mortality and DALYs in Central Latin America in 2021. Meanwhile, the disease burden of CKD and its associated anemia also showed significant differences at different national levels probably mainly due to population growth and aging. Moreover, the prediction analysis showed that the ASR of incidence attributable to CKD continued to increase.

Conclusions: With the global population growth and aging, the disease burden of CKD and its associated anemia is still high and varies significantly at the global, regional, and national levels, which requires healthcare professionals to refine targeted interventions.

Keywords: Age-standardized rates; Anemia; Chronic kidney disease; Disability-adjusted life years; GBD; Socio-demographic index.


Conflict of interest statement

Declarations. Ethical approval: Ethical approval and consent were not required as this study was based on publicly available data. Consent for publication: Not applicable. Competing interests: The authors declare no competing interests.

Figures

Fig. 1
Fig. 1
Joinpoint regression analysis of age-standardized rates of incidence, prevalence, mortality, and DALYs for CKD from 1990 to 2021. (A) Incidence; (B) Prevalence; (C) Mortality; (D) DALYs. DALYs, disability-adjusted life years; CKD, chronic kidney disease
Fig. 2
Fig. 2
Numbers and age-specific rates of incidence, prevalence, mortality, and DALYs for CKD by age group and sex in 2021. (A) Incidence; (B) Prevalence; (C) Mortality; (D) DALYs; bar charts represent counts; lines represent crude rates. CKD, chronic kidney disease; DALYs, disability-adjusted life years
Fig. 3
Fig. 3
Numbers and age-standardized rates of incidence, prevalence, mortality, and DALYs for CKD by year and sex from 1990 to 2021. (A) Incidence; (B) Prevalence; (C) Mortality; (D) DALYs. Bar charts represent counts; lines represent crude rates. CKD, chronic kidney disease; DALYs, disability-adjusted life years
Fig. 4
Fig. 4
Time trends in age-standardized rates of incidence, prevalence, mortality, and DALYs for CKD from 1990 to 2021 by SDI quintile. (A) Incidence; (B) Prevalence; (C) Mortality; (D) DALYs. DALYs, disability-adjusted life years; CKD, chronic kidney disease; SDI, socio-demographic index
Fig. 5
Fig. 5
AAPC in age-specific rates of incidence, prevalence, mortality, and DALYs for CKD by age groups and regions from 1990 to 2021. (A) AAPC of incidence; (B) AAPC of prevalence; (C) AAPC of Mortality; (D) AAPC of DALYs. AAPC, average annual percentage change; DALYs, disability-adjusted life years; CKD, chronic kidney disease
Fig. 6
Fig. 6
Global maps of CKD burden in 204 countries and territories. (A) age-standardized rate of incidence in 2021; (B) AAPCs in age-standardized incidence rate from 1990 to 2021; (C) age-standardized rate of DALYs in 2021; (D) AAPCs in age-standardized DALYs rate from 1990 to 2021. CKD, chronic kidney disease; AAPC, average annual percentage change; DALYs, disability-adjusted life years
Fig. 7
Fig. 7
Absolute differences in non-fatal trend equality for males and females in age-standardized rates of incidence, prevalence, mortality, and DALYs for CKD from 1990 to 2021. (A) Incidence; (B) Prevalence; (C) Mortality; (D) DALYs. DALYs, disability-adjusted life years; CKD, chronic kidney disease
Fig. 8
Fig. 8
Changes in incidence, prevalence, mortality, and DALYs of CKD according to aging, population growth, and epidemiological change from 1990 to 2021 at the global level by SDI quintile and various regions. (A) Incidence; (B) Prevalence; (C) Mortality; (D) DALYs. The black dots indicate the total value of change attributable to all three components. DALYs, disability-adjusted life years; CKD, chronic kidney disease; SDI, socio-demographic index
Fig. 9
Fig. 9
Prediction of CKD in number and age-standardized rate of incidence, prevalence, mortality, and DALYs. (A) Incidence; (B) Prevalence; (C) Mortality; (D) DALYs. CKD, chronic kidney disease; DALYs, disability-adjusted life years

References

    1. Li Y, Ning Y, Shen B, et al. Temporal trends in prevalence and mortality for chronic kidney disease in China from 1990 to 2019: An analysis of the global burden of disease study 2019. Clin Kidney J. 2023;16(2):312–21. - PMC - PubMed
    1. Romagnani P, Agarwal R, Chan JCN, et al. Chronic kidney disease. Nat Rev Dis Primers. 2025;11(1):8. - PubMed
    1. Selby NM, Taal MW. What every clinician needs to know about chronic kidney disease: Detection, classification and epidemiology. Diabetes Obes Metab. 2024;26(Suppl, 6):3–12. - PubMed
    1. GBD. Diseases and injuries collaborators. Global burden of 369 diseases and injuries in 204 countries and territories, 1990-2019. A systematic analysis for the global burden of disease study 2019. Lancet. 2019. 2020;396(10258):1204–22. - PMC - PubMed
    1. GBD Chronic Kidney Disease Collaboration. Global, regional, and national burden of chronic kidney disease, 1990-2017. A systematic analysis for the global burden of disease study 2017. Lancet. 2020;395(10225):709–33. - PMC - PubMed

MeSH terms

LinkOut - more resources