

Development and validation of a risk identification model for frailty in stroke survivors: new evidence from CHARLS
- PMID: 40866896
- PMCID: PMC12382056
- DOI: 10.1186/s12889-025-24198-7
Development and validation of a risk identification model for frailty in stroke survivors: new evidence from CHARLS
Abstract
Background: Stroke survivors with frailty exhibit elevated rates of complications, mortality, disability, and hospital readmission. As frailty represents an early, reversible, and preventable stage of disability, developing a reliable risk identification model is essential. This study aimed to develop and validate a risk model for frailty among stroke survivors using data from the China Health and Retirement Longitudinal Study (CHARLS).
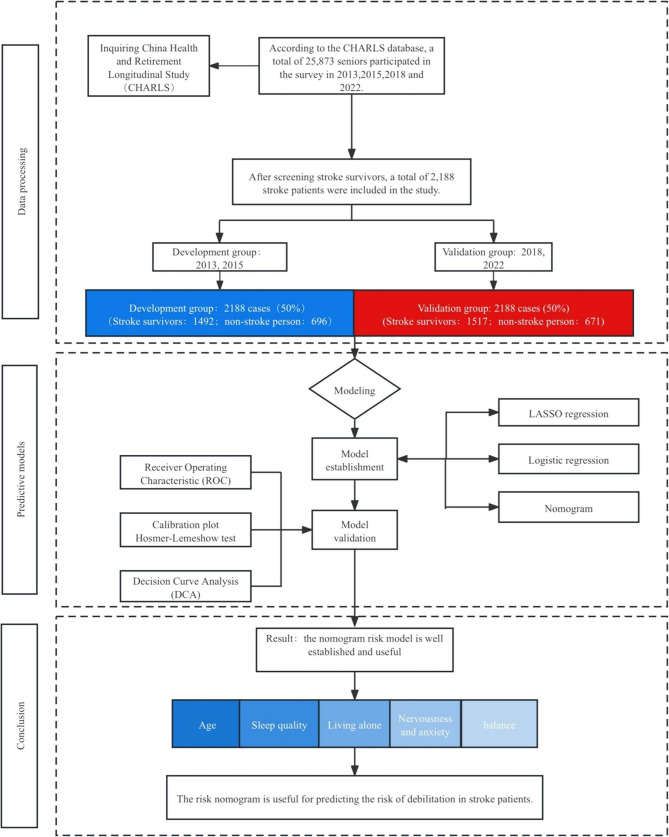
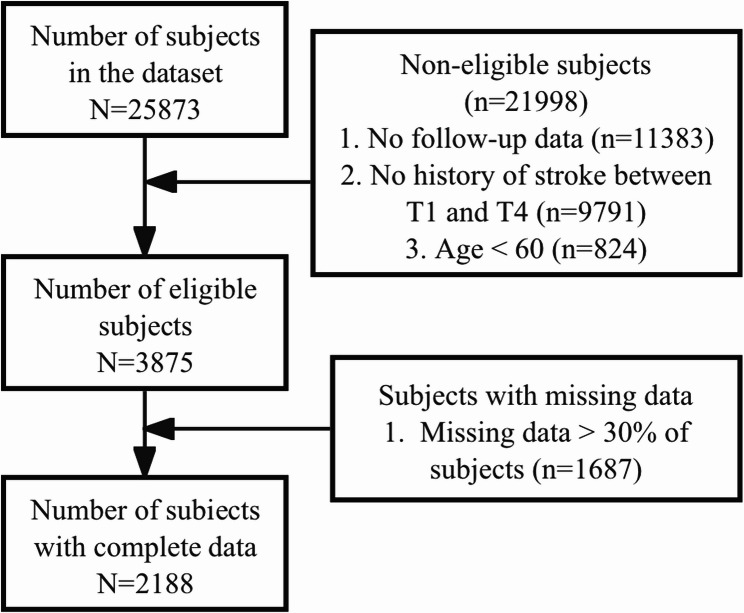
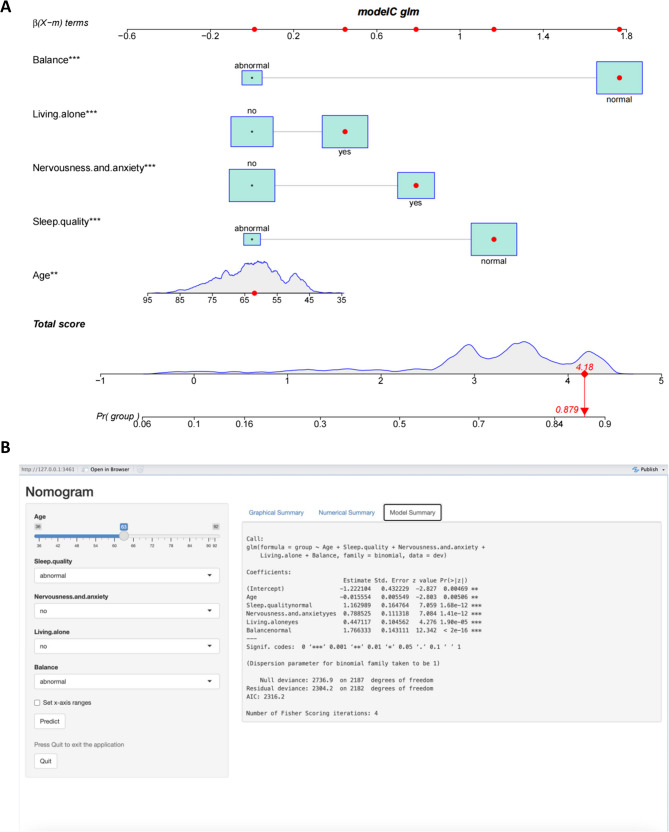
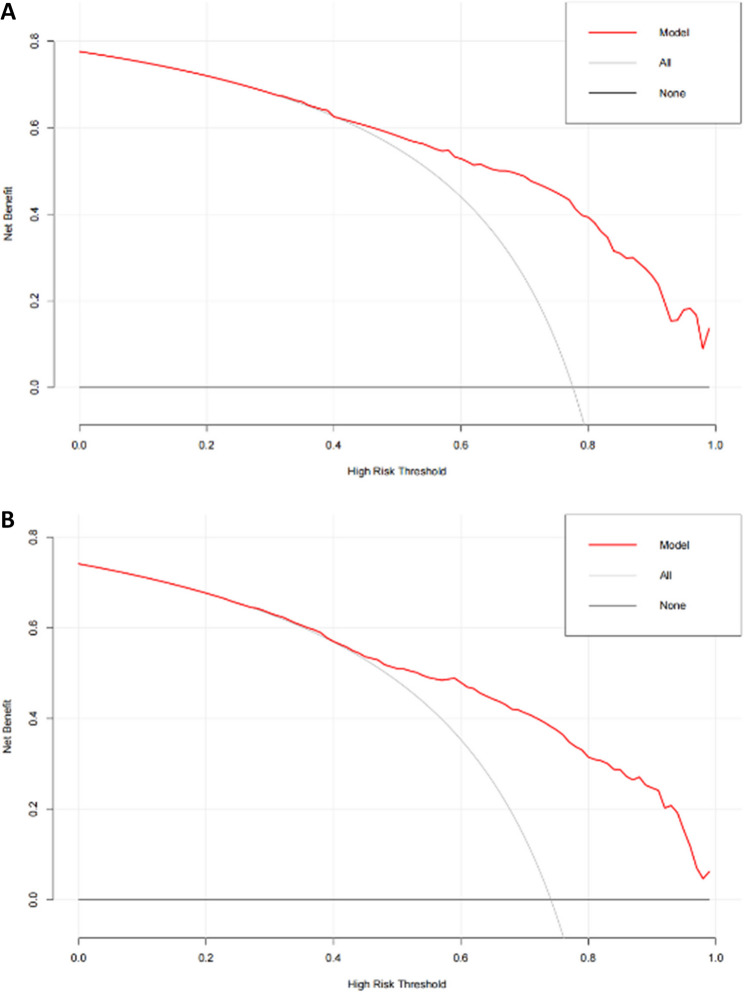
Methods: Data were extracted from the CHARLS database. Stroke survivors were identified and assessed across 30 indicators, including socio-demographic, physical, psychological, cognitive, and social variables. The data were divided by year, with 2013 and 2015 as the development set and 2018 and 2020 as the validation set. Least Absolute Shrinkage and Selection Operator (LASSO) regression was employed for variable selection. Logistic regression models were then developed based on univariate and LASSO-selected predictors. A nomogram was constructed to facilitate risk visualization. Calibration curves and decision curve analysis were used to evaluate model calibration and clinical utility.
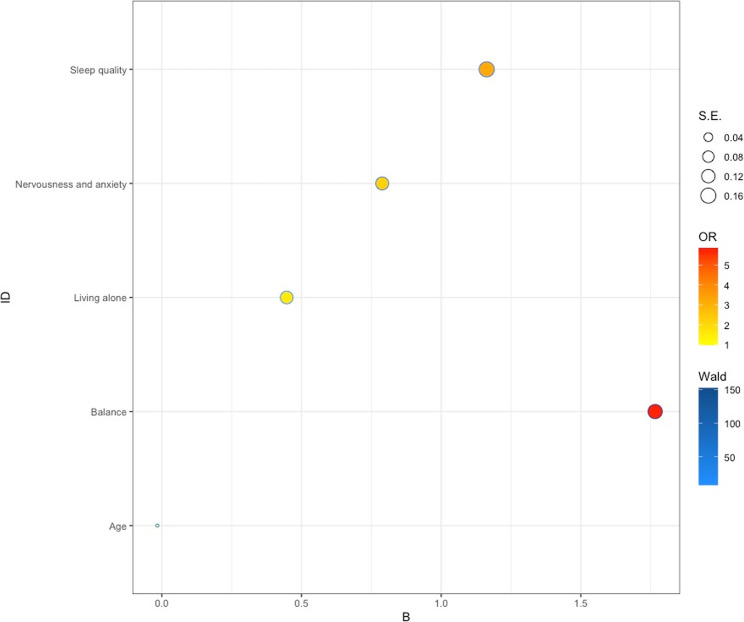
Findings: A total of 2,188 stroke survivors from the 2013, 2015, 2018, and 2020 follow-ups were included. Approximately 68% exhibited symptoms of frailty. Significant group differences were found by age, marital status, living alone, hypertension, and self-reported health status (all p < 0.05). Age, poor sleep quality, impaired balance, nervousness/anxiety, and living alone emerged as independent risk factors for frailty. The area under the receiver operating characteristic (ROC) curve for the development and validation sets was 0.833 and 0.838, respectively.
Interpretation: The model derived from CHARLS data identified 5 readily assessable predictors (age, sleep quality, balance, anxiety, and living alone), allowing for early screening of frailty without specialized instruments. It demonstrated superior discriminatory performance compared to models from smaller-sample studies, supporting targeted interventions and providing valuable insights for identifying high-risk stroke survivors.
Interpretation: The model derived from CHARLS data identified 5 readily assessable predictors (age, sleep quality, balance, anxiety, and living alone), allowing for early screening of frailty without specialized instruments. It demonstrated superior discriminatory performance compared to models from smaller-sample studies, supporting targeted interventions and providing valuable insights for identifying high-risk stroke survivors.
Keywords: CHARLS; Frailty; Logistic regression; Risk identification model; Stroke.
© 2025. The Author(s).
Conflict of interest statement
Declarations. Ethics approval and consent to participate: This is a retrospective study based on CHARLS database. Participant information was hidden prior to the study. No participant informed consent was required and there was no ethical conflict. The original version of CHARLS was approved by the Ethics Review Board of Peking University (IRB00001052-11015) and all participants signed an informed consent form at the time of participation. The study followed the guiding principles of the Declaration of Helsinki. The study protocol was approved by the CHARLS Institutional Review Board and followed the guiding principles of the Declaration of Helsinki. Consent for publication: Not applicable. Competing interests: The authors declare no competing interests.
Figures


References
Publication types
MeSH terms
Grants and funding
- NO. 82260281/Innovative Research Group Project of the National Natural Science Foundation of China
- NO. ZK [2024] key Project 069/Guizhou Science and Technology Cooperation (Qian ke he) Foundation
- gzwkj2023-588/2023 Science and Technology Fund Project of Guizhou Provincial Health and Wellness Commission
LinkOut - more resources
Full Text Sources
Medical
Research Materials
