. 2025 Sep;15(9):e70438.
doi: 10.1002/ctm2.70438.

β-elemene promotes ferroptosis to improve the sensitivity of imatinib in gastrointestinal stromal tumours by targeting N6AMT1

Affiliations

β-elemene promotes ferroptosis to improve the sensitivity of imatinib in gastrointestinal stromal tumours by targeting N6AMT1

Jin Lan et al. Clin Transl Med. 2025 Sep.

Abstract

Background: Imatinib has been widely used in gastrointestinal stromal tumours and significantly improved the prognosis of GIST patients, but approximately half of patients develop acquired treatment resistance, highlighting the urgency for novel therapeutic strategies.

Methods: A variety of bioinformatic tools and laboratory experiments, RNA sequencing, animal models and the thermal proteome profiling assay were employed to validate our findings and investigate the antitumour effects of β-elemene.

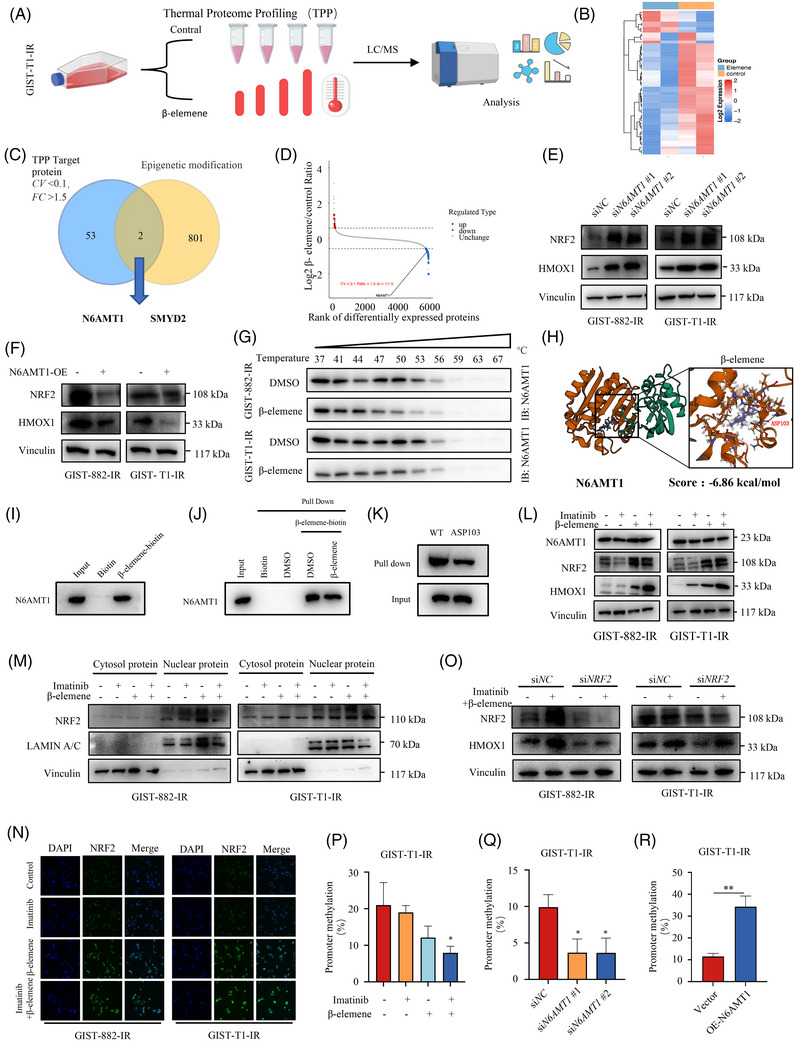
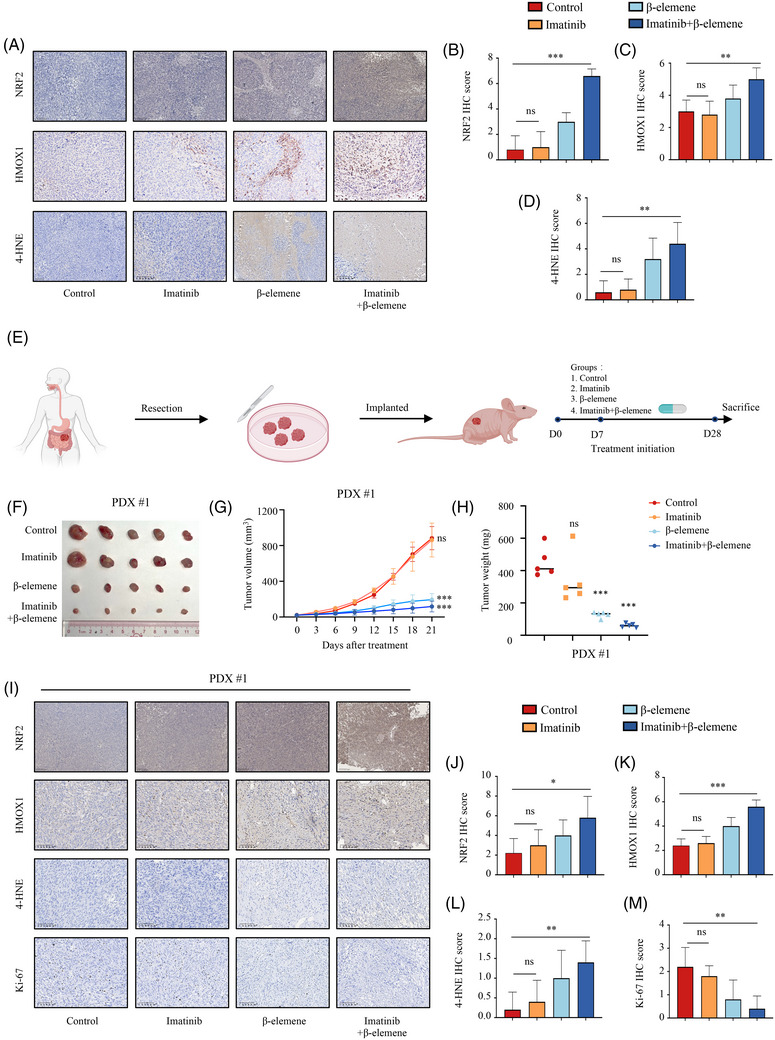
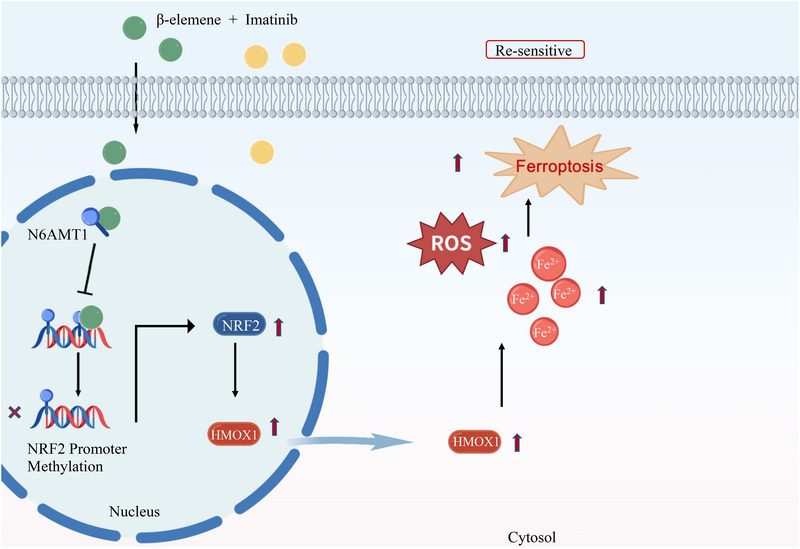
Results: We found that imatinib-resistant GIST was associated with negative regulation of ferroptosis activity, and inducing ferroptosis can enhance the sensitivity of resistant cells to imatinib. Furthermore, we found that β-elemene enhances imatinib sensitivity in imatinib-resistant GIST cells through inducing ferroptosis. Moreover, the combination treatment of β-elemene and imatinib showed significantly increased antitumour efficacy, compared to each monotherapy, both in vitro and in vivo. Mechanistically, β-elemene specifically targets N6AMT1, inhibiting its transcriptional repression function and activating the nuclear factor erythroid 2-related factor 2 (NRF2)-HMOX1 signalling pathway to induce ferroptosis.

Conclusion: Β-elemene can target N6AMT1 and promote ferroptosis by increasing the expression of NRF2 and HMOX1. These findings suggest β-elemene as a prospective therapeutic strategy to improve the sensitivity of imatinib in gastrointestinal stromal tumours.

Key points: l Imatinib resistance is associated with ferroptosis activity in GIST. l Combination of β-elemene and imatinib effectively treats gastrointestinal stromal tumours both in vivo and in vitro. l β-elemene promotes imatinib sensitivity in GIST through ferroptosis. l N6AMT1 is a potential target of β-elemene. l β-elemene targets N6AMT1 to promote imatinib sensitivity in imatinib-resistant GIST cells via the NRF2/HMOX1 axis.

Keywords: ROS; ferroptosis; gastrointestinal stromal tumours; imatinib resistance; β‐elemene.


Conflict of interest statement

The authors declare no conflicts of interest.

Figures

FIGURE 1
FIGURE 1
Imatinib resistance is associated with ferroptosis activity in gastrointestinal stromal tumour (GIST). (A) Heatmap of differentially expressed genes (DEGs) in imatinib‐naïve and ‐resistant GISTs from the GSE132542 dataset. (B) Gene ontology analysis of DEGs between imatinib‐naïve and ‐resistant GISTs from the GSE132542 dataset (all absolute log2 fold change > .5, false discovery rate (FDR) < 10%). (C) Gene set enrichment analysis (GSEA) plots of negative regulation of cell death signalling pathway. (D) Western blotting analysis of caspase‐3, cleaved caspase‐3, caspase7, cleaved caspase‐7, phosphorylated RIP1, total RIP1, phosphorylated RIP3, total RIP3, GSDME, cleaved GSDME, GSDMD, cleaved GSDMD, ferritin heavy chain (FTH1) and glutathione peroxidase 4 (GPX4), solute carrier family 7 member 11 (SLC7A11), FSP1 and dihydroorotate dehydrogenase (DHODH) expression in parental and imatinib‐resistant (IR) GIST‐882 cells treated with 882 20 µM imatinib for 24 h (for GIST‐882 and 20 nM for GIST‐T1, 24 h). Vinculin was included as a loading control. (E) Western blotting analysis of caspase‐3, cleaved caspase‐3, caspase7, cleaved caspase‐7, phosphorylated RIP1, total RIP1, phosphorylated RIP3, total RIP3, GSDME, cleaved GSDME, GSDMD, cleaved GSDMD, FTH1 and GPX4, SLC7A11, FSP1 and DHODH expression in parental and IR GIST‐T1 cells treated with 20 nM imatinib for 24 h. Vinculin was included as a loading control. (F) The expression of FTH1 and GPX4 in imatinib‐sensitive and imatinib‐resistant GIST specimens using immunohistochemistry (IHC) staining assay (Mann–Whitney U test). (G) Statistics of FTH1 expression in imatinib‐sensitive (n = 30) and imatinib‐resistant GIST specimens (= 10) and percentage of GIST specimens with high or low FTH1 expression. (H) Statistics of GPX4 expression in imatinib‐sensitive (n = 30) and imatinib‐resistant GIST specimens (n = 10) and percentage of GIST specimens with high or low GPX4 expression. (I) Western blotting analysis showing the protein levels of FTH1, GPX4, SLC7A11, FSP1 and DHODH in six GIST specimens, including three samples from patients with imatinib‐treated PD(Progressive Disease) and three samples from patients with imatinib‐treated PR(Partial Response). Data represent the mean ± standard deviation (SD); *p < .05; **p < .01; ***p < .001. An unpaired t‐test was used unless otherwise stated.
FIGURE 2
FIGURE 2
Ferroptosis activity is suppressed in acquired imatinib‐resistant GIST cells and inducing ferroptosis can promote imatinib sensitivity. (A) Representative fluorescent images of lipid peroxidation detected by BODIPY (581/591) C11 probe in GIST‐882, GIST‐882‐IR, GIST‐T1 and GIST‐T1‐IR with or without treatment of imatinib for 24 h. Scale bar = 100 µm. (B) Quantification of relative fluorescence intensity of oxidised BODIPY by Image J. (C) The Fe2+ levels detected by FerroOrange fluorescence probe in GIST‐882, GIST‐882‐IR, GIST‐T1 and GIST‐T1‐IR cells with or without treatment of imatinib. (D) Quantification of relative fluorescence intensity of Fe2+ levels by Image J. (E) The malondialdehyde (MDA) levels detected in GIST‐882, GIST‐882‐IR, GIST‐T1 and GIST‐T1‐IR cells with or without treatment of imatinib. (F) Cell viability of imatinib‐exposed GIST‐882‐IR and GIST‐T1‐IR pretreated with erastin and RAS‐selective lethal 3 (RSL3) or not was detected via CCK‐8 assay. (G) Cell death measurements were taken using flow cytometry analysis and statistical histograms of propidium iodide (PI)‐positive cells in IM‐exposed GIST‐882‐IR and GIST‐T1‐IR, pretreated with erastin and RSL3. (H) Statistical analysis of the cell death. All experiments were performed in triplicate, and relative colony numbers are shown as means ± SD. (I) Antitumour effects of imatinib in imatinib‐exposed GIST‐882‐IR and GIST‐T1‐IR pretreated with erastin and RSL3 or not were evaluated by colony formation assay. (J) Statistical analysis of the colony formation assay. All experiments were performed in triplicate. Data represent the mean ± SD; *p < .05; **p < .01; ***p < .001. An unpaired t‐test was used unless otherwise stated.
FIGURE 3
FIGURE 3
β‐elemene induces ferroptosis in imatinib‐resistant GIST cells. (A) Chemical structure of β‐elemene. (B‐C) Kyoto Encyclopedia of Genes and Genomes pathway enrichment analysis and GSEA showed that genes involved in ferroptosis were significantly dysregulated under β‐elemene treatment. (D) The Fe2+ levels detected by FerroOrange fluorescence probe in GIST‐882‐IR and GIST‐T1‐IR cells treated with DMSO, imatinib, β‐elemene or imatinib+β‐elemene for 24 h. (E) Quantification of relative fluorescence intensity of Fe2+ levels by Image J. (F) The MDA levels detected in GIST‐882‐IR and GIST‐T1‐IR cells treated with DMSO, imatinib, β‐elemene or imatinib+β‐elemene for 24 h. (G) Representative fluorescent images of lipid peroxidation detected by BODIPY (581/591) C11 probe in GIST‐882‐IR and GIST‐T1‐IR cells treated with DMSO, imatinib, β‐elemene or imatinib+β‐elemene for 24 h. Scale bar = 100 µm. (H) Quantification of relative fluorescence intensity of oxidised BODIPY by Image J. (I) The ROS accumulation was detected using flow cytometry analysis and statistical histograms of positive cells in GIST‐882‐IR and GIST‐T1‐IR cells treated with DMSO, imatinib, β‐elemene or imatinib+β‐elemene for 24 h. (J) Representative cell ultrastructural images of GIST‐T1‐IR cells treated with DMSO, imatinib, β‐elemene or imatinib+β‐elemene for 24 h. All experiments were performed in triplicate. Data represent the mean ± SD; *p < .05; **p < .01; ***p < .001. An unpaired t‐test was used unless otherwise stated.
FIGURE 4
FIGURE 4
β‐elemene promotes imatinib sensitivity in imatinib‐resistant GISTs through ferroptosis. (A) The interaction between imatinib and β‐elemene on cell cytotoxicity was examined by the median‐effect method of Chou–Talalay. (B) The dose and combination index of imatinib in combination with β‐elemene on GIST‐882‐IR and GIST‐T1‐IR cells was estimated by calculation of combination index (CI) values using Compusyn software. The darker point indicates a stronger synergistic effect. The fraction affected values indicate the percentage of cell inhibition, while the CI values indicate the effects of combination treatments. (C) Antitumour effects of imatinib and β‐elemene in GIST‐882‐IR and GIST‐T1‐IR cells after the indicated treatment were evaluated by colony formation assay. (D) Statistical analysis of the colony formation assay. (E) Representative results of PI‐positive cells in IM‐exposed GIST‐882‐IR and GIST‐T1‐IR after the indicated treatment and quantitative analysis after the treatment for 48 h. (F) Statistical histogram of the flow cytometry cell death analysis. (G) Antitumour effects of GIST‐882‐IR and GIST‐T1‐IR cells treated with or without ferroptosis inhibitor Ferrostatin‐1 (Fer‐1) were evaluated by colony formation assay. (H) Statistical analysis of the colony formation assay of GIST‐882‐IR and GIST‐T1‐IR cells treated with or without ferroptosis inhibitor Fer‐1. (I) Cell viability of GIST‐882‐IR and GIST‐T1‐IR cells treated with or without ferroptosis inhibitor Fer‐1. (J) Schematic description of the in vivo anticancer effect of combined treatment with β‐elemene and imatinib in the cell line‐based xenograft model. (K) Photograph and comparison of tumour sizes in the indicated groups. (L) Growth curve of GIST‐T1‐IR xenografts in the indicated groups. (M) The tumour weight of GIST‐T1‐IR xenografts in the indicated groups. (N) Representative images of IHC staining of MKI67/K‐67 in mouse tumours. All experiments were performed in triplicate. Data represent the mean ± SD; *p < .05; **p < .01; ***p < .001. An unpaired t‐test was used unless otherwise stated.
FIGURE 5
FIGURE 5
β‐elemene induced ferroptosis in imatinib‐resistant GISTs through HMOX1. (A) Heatmap of the RNA‐seq analysis results for GIST‐T1‐IR cells treated with DMSO or β‐elemene. (B) Volcano plot of down‐regulated and upregulated for GIST‐T1‐IR cells treated with DMSO or β‐elemene. (C) Western blotting analysis of HMOX1 and GPX4 expression in GIST cells treated with imatinib, β‐elemene or imatinib+β‐elemene. (D) Western blotting analysis of HMOX1 expression in parental and imatinib‐resistant GIST cells. (E) Western blotting analysis of HMOX1 in GIST‐882‐IR and GIST‐T1‐IR cells transfected with HMOX1‐expressing plasmid. (F) CCK‐8 assay of sensitivity to imatinib in HMOX1‐overexpressed GIST‐882‐IR and GIST‐T1‐IR cells versus control GIST‐882_IR and GIST‐T1‐IR cells. (G) The colony formation assay of sensitivity to imatinib in HMOX1‐overexpressed GIST‐882‐IR and GIST‐T1‐IR cells versus control GIST‐882_IR and GIST‐T1‐IR cells. (H) Western blot showing changes in HMOX1 expression in response to Hemin. (I‐J) The colony formation assay and statistical histogram of GIST‐882‐IR and GIST‐T1‐IR cells treated with imatinib+β‐elemene with or without hemin. (K) Cell death measurements by flow cytometry analysis in GIST‐882‐IR and GIST‐T1‐IR cells treated with imatinib+β‐elemene with or without hemin. (L–M) The colony formation assay and statistical histogram of GIST‐882‐IR and GIST‐T1‐IR cells treated with imatinib+β‐elemene with or without zinc protoporphyrin‐9 (ZnPP). (N) Cell death measurements by flow cytometry analysis in GIST‐882‐IR and GIST‐T1‐IR cells treated with imatinib+β‐elemene with or without ZnPP. (O) Photograph and comparison of tumour sizes in different groups. (P) Growth curve of GIST‐T1‐IR xenografts in the indicated groups. (Q) The tumour weight of GIST‐T1‐IR xenografts in the indicated groups. All experiments were performed in triplicate. Data represent the mean ± SD; *p < .05; **p < .01; ***p < .001. An unpaired t‐test was used unless otherwise stated.
FIGURE 6
FIGURE 6
β‐elemene targets N6AMT1 to promote imatinib sensitivity in imatinib‐resistant GIST cells via the nuclear factor erythroid 2‐related factor 2 (NRF2)/HMOX1 axis. (A) The workflow for cellular targets identification of β‐elemene in GIST‐T1‐IR by thermal proteome profiling (TPP). (B) Heatmap of differentially expressed protein in GIST‐T1‐IR cells between control and β‐elemene‐treated groups. (C) Venn diagram of β‐elemene target screening. (D) Volcano plot of cellular targets of β‐elemene by the TPP strategy. (E) Western blot analysis of NRF2 and HMOX1 in GIST cells with or without N6AMT1 knockdown by small interfering RNA (siRNA). (F) Western blot analysis of NRF2 and HMOX1 in GIST cells with or without N6AMT1 overexpression. (G) Cellular thermal shift assay demonstrated a stabilisation effect of N6AMT1 with β‐elemene. (H) The interaction between β‐elemene with N6AMT1 targeting Asp103 was predicted by molecular docking. (I) GIST‐T1‐IR cell lysates were incubated with either biotin or β‐elemene‐biotin at 4°C overnight, and then a pulldown assay was performed. (J) GIST‐T1‐IR cell lysates were preincubated with either DMSO or free β‐elemene, followed by subsequent incubation with β‐elemene‐biotin. The interaction between N6AMT1 and β‐elemene was then detected by capturing β‐elemene‐biotin. (K) The mutant N6AMT1 proteins were incubated with β‐elemene, followed by protein affinity pull‐down assay and detected by immunoblotting. (L) Western blot analysis of N6AMT1/NRF2/HMOX1 axis in GIST cells treated with imatinib, β‐elemene or imatinib+β‐elemene. (M) Western blot analysis of NRF2 in cytosol protein and nuclear protein. (N) The staining intensity and localisation of NRF2 in the indicated groups were analysed by immunofluorescence staining. (O) Western blot analysis of the relationship of NRF2 and HMOX1 in ferroptosis with knockdown of NRF2 in GIST cells followed by imatinib+β‐elemene treatment. (P) Methylation level of NRF2 promoter in GIST‐T1‐IR cell treated with imatinib, β‐elemene or imatinib+β‐elemene. (Q) Methylation level of NRF2 promoter in GIST‐T1‐IR cell with or without N6AMT1 knockdown by siRNA. (R) Methylation level of NRF2 promoter in GIST‐T1‐IR cell with or without N6AMT1 overexpression. Data represent the mean ± SD; *p < .05; **p < .01; ***p < .001. An unpaired t‐test was used unless otherwise stated.
FIGURE 7
FIGURE 7
β‐elemene improves imatinib therapeutic efficiency in imatinib‐resistant GIST. (A–D) IHC staining of Nrf2, HMOX1 and 4‐HNE in tumour tissues generated by GIST‐T1‐IR cells‐based xenograft in the indicated groups. Scale bars, 50 µm. (E) Schematic description of the in vivo anticancer effect of combined treatment with imatinib and β‐elemene in the patient‐derived xenograft (PDX) model. (F) Photograph and comparison of tumour sizes of the PDX model in the indicated groups. (G) Growth curve of the PDX model in the indicated groups. (H) The tumour weight of the PDX model in the indicated groups. (I–M) IHC staining of 4‐HNE and HMOX1 in tumour tissues generated by the PDX model in the indicated groups. Scale bars, 50 µm. Data represent the mean ± SD; *p < .05; **p < .01; ***p < .001. An unpaired t‐test was used unless otherwise stated.
FIGURE 8
FIGURE 8
Summary diagram of the mechanism that β‐elemene increased the sensitivity of GIST cells to imatinib. β‐elemene specifically targets N6AMT1, inhibiting its transcriptional repression function and activating the NRF2‐HMOX1 signalling pathway to induce ferroptosis.

Similar articles

References

    1. Demetri GD, von Mehren M, Antonescu CR, et al. NCCN Task Force report: update on the management of patients with gastrointestinal stromal tumors. J Natl Compr Canc Netw. 2010;8(suppl 2)(0 2):S1‐41. doi: 10.6004/jnccn.2010.0116 - DOI - PMC - PubMed
    1. de Pinieux G, Karanian M, Le Loarer F, et al. Nationwide incidence of sarcomas and connective tissue tumors of intermediate malignancy over four years using an expert pathology review network. PLoS One. 2021;16(2):e0246958. doi: 10.1371/journal.pone.0246958 - DOI - PMC - PubMed
    1. Heinrich MC, Corless CL, Duensing A, et al. PDGFRA activating mutations in gastrointestinal stromal tumors. Science. 2003;299(5607):708‐710. doi: 10.1126/science.1079666 - DOI - PubMed
    1. Demetri GD, von Mehren M, Blanke CD, et al. Efficacy and safety of imatinib mesylate in advanced gastrointestinal stromal tumors. N Engl J Med. 2002;347(7):472‐480. doi: 10.1056/NEJMoa020461 - DOI - PubMed
    1. Kee D, Zalcberg JR. Current and emerging strategies for the management of imatinib‐refractory advanced gastrointestinal stromal tumors. Ther Adv Med Oncol. 2012;4(5):255‐270. doi: 10.1177/1758834012450935 - DOI - PMC - PubMed

MeSH terms

LinkOut - more resources