. 2025 Aug 27;20(1):93.
doi: 10.1186/s13024-025-00882-5.

Large-scale CSF proteome profiling identifies biomarkers for accurate diagnosis of frontotemporal dementia

Affiliations

Large-scale CSF proteome profiling identifies biomarkers for accurate diagnosis of frontotemporal dementia

Yanaika S Hok-A-Hin et al. Mol Neurodegener. .

Abstract

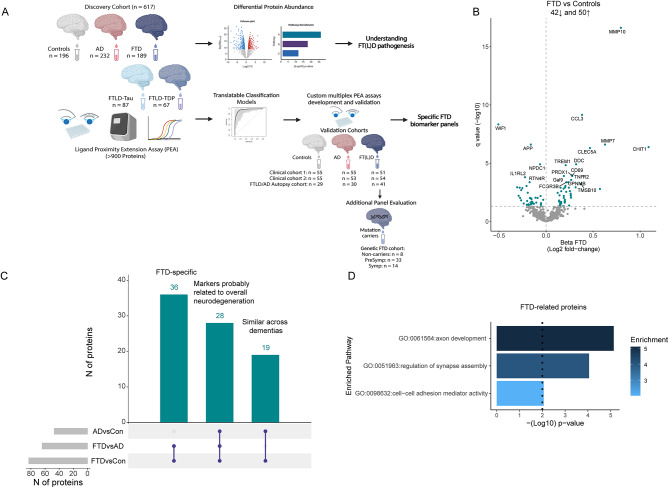
Background: Diagnosis of Frontotemporal dementia (FTD) and its specific underlying neuropathologies (frontotemporal lobar degeneration; FTLD-Tau and FTLD-TDP) are challenging, and thus, fluid biomarkers are needed to improve diagnostic accuracy.

Methods: We used proximity extension assays to analyze 665 proteins in cerebrospinal fluid (CSF) samples from a multicenter cohort, which included patients with FTD (n = 189), Alzheimer’s Disease dementia (AD; n = 232), and cognitively unimpaired individuals (n = 196). In a subset, FTLD neuropathology was determined based on phenotype or genotype (FTLD-Tau = 87 and FTLD-TDP = 67). Differences in protein expression profiles were analyzed using nested linear models. Penalized generalized linear modeling was used to identify classification protein panels, which were translated to custom multiplex assays and validated in two clinical cohorts (cohort 1: n = 161; cohort 2: n = 162), one autopsy-confirmed cohort (n = 100), and one genetic cohort (n = 55).

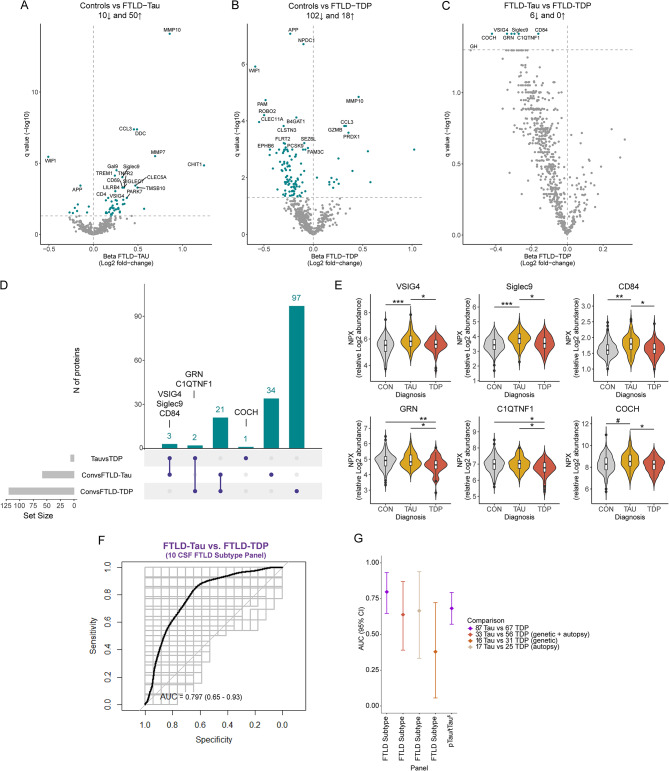
Results: Forty-three proteins were differentially regulated in FTD compared to controls and AD, reflecting axon development, regulation of synapse assembly, and cell-cell adhesion mediator activity pathways. Classification analysis identified a 14- and 13-CSF protein panel that discriminated FTD from controls (FTD diagnostic panel, AUC: 0.96) or AD (FTD differential diagnostic panel, AUC: 0.91). Custom multiplex panels confirmed the strong discriminative performancen between FTD and controls (AUCs > 0.96) and between FTD and AD (AUCs > 0.88) across three validation cohorts, including one with autopsy confirmation (AUCs > 0.90). Validation in genetic FTD (including C9orf72, GRN, and MAPT mutation carriers) revealed high accuracy of the FTD diagnostic panel in identifying both the presymptomatic (AUCs > 0.95) and symptomatic (AUC: 1) stages. Six proteins were differentially regulated between FTLD-TDP and FTLD-Tau. However, a reproducible classification model could not be generated (AUC: 0.80).

Conclusions: Overall, this study introduces novel FTD-specific biomarker panels with potential use in diagnostic settings.

Supplementary Information: The online version contains supplementary material available at 10.1186/s13024-025-00882-5.

Keywords: Biomarkers; CSF; FTD; FTLD; Proteomics; TDP43; Tau.


Conflict of interest statement

Declarations. Ethics approval and consent to participate: Approval was given by the institutional ethical review boards of each center. Written informed consent was obtained from all participants or their authorized representatives. Consent for publication: Not applicable. Competing interests: Y.H., C.P., E.E., S.B., L.M, J.S., J.H., H.R., W.H., A.S., A.C.-P, and D.I. declare no competing interest. M.C. has been an invited speaker at Eisai, is an associate editor at Alzheimer´s Research & Therapy and has been an invited writer for Springer Healthcare. L.V. received a grant for CORAL consortium by Olink proteomics. D.I. is a Scientific Advisory Board Member for Denali Therapeutics. D.A. participated in advisory boards from Fujirebio-Europe and Roche Diagnostics and received speaker honoraria from Fujirebio-Europe, Roche Diagnostics, Nutricia, Krka Farmacéutica S.L., Zambon S.A.U. and Esteve Pharmaceuticals. S.A. D.A., and A.L. declare a filed patent application (Title: Markers of synaptopathy in neurodegenerative disease; Applicant: Fundació Institut de Recerca de l’Hospital de la Santa Creu i Sant Pau, Inventors: Olivia BELBIN; Alberto LLEÓ; Alejandro BAYÉS; Juan FORTEA; Daniel ALCOLEA; Application number: PCT/EP2019/056535; International Publication Number: WO 2019/175379 A1; Current status: Active. Licensed to ADx Neurociences NV (Ghent, Belgium); this patent is not related to any specific aspect of the current manuscript). S.E. received personal fees from Eisai (paid to institution), personal fees from icometrix (paid to institution), personal fees from Novartis (paid to institution), personal fees from Roche (paid to institution) and personal fees from Roche and personal fees from Biogen, all outside the submitted work. W.F. has performed contract research for Biogen MA Inc, and Boehringer Ingelheim. W.F. has been an invited speaker at Boehringer Ingelheim, Biogen MA Inc, Danone, Eisai, WebMD Neurology (Medscape), Springer Healthcare. W.F. is consultant to Oxford Health Policy Forum CIC, Roche, and Biogen MA Inc. WF participated in advisory boards of Biogen MA Inc and Roche. All funding is paid to her institution. W.F. is a member of the steering committee of PAVE, and Think Brain Health. W.F. was associate editor of Alzheimer’s Research & Therapy in 2020/2021 and is currently an associate editor at Brain. C.E.T. has a collaboration contract with ADx Neurosciences, Quanterix, and Eli Lilly, performed contract research or received grants from AC-Immune, Axon Neurosciences, Bioconnect, Bioorchestra, Brainstorm Therapeutics, Celgene, EIP Pharma, Eisai, Grifols, Novo Nordisk, PeopleBio, Roche, Toyama, and Vivoryon. She serves on editorial boards of Medidact Neurologie/Springer, Alzheimer’s Research & Therapy, Neurology: Neuroimmunology & Neuroinflammation, and is editor of a Neuromethods book Springer. She had speaker contracts for Roche, Grifols, and Novo Nordisk.

Figures

Fig. 1
Fig. 1
Overview study design and differential abundance of CSF proteins in FTD. (A) More than 900 proteins were measured using the antibody-based PEA technology in CSF from 196 cognitively unimpaired controls (white), 189 FTD (blue), and 232 AD (red) patients. Differential protein abundance was investigated and classification models were constructed. Custom PEA assays using the proteins identified in the classification models were developed and validated in four independent cohorts, including an FTLD/AD autopsy cohort and genetic cohort. (B) Volcano plots show that 93 CSF proteins were differentially regulated between FTD and controls. Each dot represents a protein. The beta coefficients (log2 fold-change) are plotted versus q values (-log10-transformed). Proteins significantly dysregulated after adjusting for false discovery rate (FDR, q < 0.05) are depicted in blue. The total number of proteins that are down-regulated (n = 42, left) or up-regulated (n = 51, right) are depicted. Horizontal dotted line indicates the significance threshold. (C) UpSet plot shows proteins dysregulated between FTD and controls and also dysregulated between FTD and AD or AD and controls. (D) Bar graphs depicting the biological pathways enriched in protein specifically dysregulated in FTD. The dotted line represents the significant threshold (p < 0.01). The corresponding GO number and biological process is depicted on the left side. Stronger colors represent higher significant enrichment
Fig. 2
Fig. 2
CSF biomarker panels for the diagnosis of FTD. (A) Receiver operating characteristic (ROC) curves depict the performance of 14-CSF biomarker panel discriminating FTD (n = 189) from controls (n = 196). Black line is the mean area under the curve (AUC) overall re-samplings (1000 repeats of 5-fold cross-validation, grey lines). (B) Forest plot shows the different AUC and 95% confidence interval for the 14 and 13 CSF biomarker panels and NfL to discriminate between FTD and controls (blue) or AD (red). (C) ROC curves depict the performance of 13-CSF biomarker panel discriminating FTD (n = 189) from AD (n = 232). (D) Correlation matrix heatmap representing the Spearman’s correlation coefficient in-between the proteins selected in each panel, MMSE score, and FTLD-CDR scores in the total cohort, and in a subset of the FTD group (n = 62)
Fig. 3
Fig. 3
Differential abundance of CSF proteins in FTLD subtypes and FTLD biomarker panel. Volcano plots show CSF proteins differentially regulated between patients with FTLD-Tau (n = 87; A) or FTLD-TDP (n = 67; B) and controls (n = 196) and between these neuropathological subtypes (C). Each dot represents a protein. The beta coefficients (log2 fold-change) are plotted versus q values (-log10-transformed). Proteins significantly dysregulated after adjusting for false discovery rate (FDR, q < 0.05) are depicted in blue. The total number of proteins that are down-regulated (left) or up-regulated (right) is indicated. D) UpSet plot depicts proteins dysregulated between the FTLD-Tau, FTLD-TDP, and control groups. E) Violins represent the abundance (log2 NPX) of the CSF proteins that were uniquely dysregulated in FTLD-Tau and FTLD-TDP or between the subtypes. Boxplot within the violin indicates the median and interquartile range of the protein abundance. F) ROC curves depict the performance of 10-CSF biomarker panel discriminating FTLD-Tau (n = 87) from FTLD-TDP (n = 67). G) Forest plot shows the different AUC and 95% confidence interval for the 10 CSF biomarker panels, and pTau/tTau ratio to discriminate between neuropathological subtypes (purple; 87 FTLD-Tau and 67 FTLD-TDP), subtypes that are genetic and/or autopsy confirmed (brown; 33 FTLD-Tau and 56 FTLD-TDP), subtypes which are genetically confirmed (coral; 16 FTLD-Tau and 31 FTLD-TDP), and subtypes which are autopsy confirmed (beige; 17 FTLD-Tau and 25 FTLD-TDP). $ shows the comparison in a subset of cases (NfL: 76 FTD, 47 controls, and 54 AD; pTau/tTau ratio: 74 FTLD-Tau and 37 FTLD-TDP. # p < 0.05, *q < 0.05, **q < 0.01, ***q < 0.001. Abbreviations: CON, cognitively unimpaired controls; TDP, transactive response DNA binding protein 43
Fig. 4
Fig. 4
Development and validation of custom CSF biomarker panels for FTD diagnosis in independent cohorts. (A) Lollipop plots depict the beta-coefficients obtained in the discovery phase in parallel to the beta-coefficients of the custom assays in clinical validation cohorts 1 and 2 and the FTLD/AD autopsy cohort. Grey dots show proteins that did not remain significant after correction for multiple testing. (B) Receiver operating characteristic (ROC) curves showing the performance of the CSF biomarker panel discriminating FTD from controls using the custom assays across the two clinical and one autopsy validation cohort. Inserts outline corresponding AUC and 95% CI. (C) Forest plots depict the different AUC and 95% CI obtained with the CSF FTD biomarker panels or CSF NfL in the comparison between FTD and controls (blue) or AD (red). (D) ROC curves showing the performance of the FTD diagnostic panel in the FTD genetic cohort to discriminate non-carriers from presymptomatic (PreSymp) and symptomatic (Symp) mutation carriers, and presymptomatic from symptomatic
Fig. 5
Fig. 5
Development and validation of custom CSF biomarker panels for FTD differential diagnosis in independent cohorts. (A) Lollipop plots depict the beta-coefficients obtained in the discovery phase in parallel to the beta-coefficients of the custom assays in clinical validation cohorts 1 and 2 and the FTLD/AD autopsy cohort. Grey dots show proteins that did not remain significant after correction for multiple testing. (B) Receiver operating characteristic (ROC) curves showing the performance of the CSF biomarker panel discriminating FTD from AD using the custom assays across the two clinical and one autopsy validation cohort. Inserts outline corresponding AUC and 95% CI. (C) Forest plots depict the different AUC and 95% CI obtained with the CSF FTD biomarker panels or CSF NfL in the comparison between FTD and AD (red) or controls (blue). (D) ROC curves showing the performance of the FTD differential diagnostic panel in the FTD genetic cohort to discriminate non-carriers from presymptomatic (PreSymp) and symptomatic (Symp) mutation carriers, and presymptomatic from symptomatic

Update of

References

    1. Gorno-Tempini ML, Hillis AE, Weintraub S, Kertesz A, Mendez M, Cappa SF et al. Classification of primary progressive aphasia and its variants. Am Acad Neurol. 2011;76. - PMC - PubMed
    1. Rascovsky K, Hodges JR, Knopman D, Mendez MF, Kramer JH, Neuhaus J, et al. Sensitivity of revised diagnostic criteria for the behavioural variant of frontotemporal dementia. Brain. 2011;134(Pt 9):2456–77. - PMC - PubMed
    1. Armstrong MJ, Litvan I, Lang AE, Bak TH, Bhatia KP, Borroni B et al. Criteria for the diagnosis of corticobasal degeneration. Am Acad Neurol. 2013;80. - PMC - PubMed
    1. Hoglinger GU, Respondek G, Stamelou M, Kurz C, Josephs KA, Lang AE, et al. Clinical diagnosis of progressive supranuclear palsy: the movement disorder society criteria. Mov Disord. 2017;32(6):853–64. - PMC - PubMed
    1. Irwin DJ, Cairns NJ, Grossman M, McMillan CT, Lee EB, Van Deerlin VM, et al. Frontotemporal lobar degeneration: defining phenotypic diversity through personalized medicine. Acta Neuropathol. 2015;129(4):469–91. - PMC - PubMed

LinkOut - more resources