

Functional Organization of the Spinal Locomotor Network Based on Analysis of Interneuronal Activity
- PMID: 40867066
- PMCID: PMC12391573
- DOI: 10.1111/ejn.70238
Functional Organization of the Spinal Locomotor Network Based on Analysis of Interneuronal Activity
Abstract
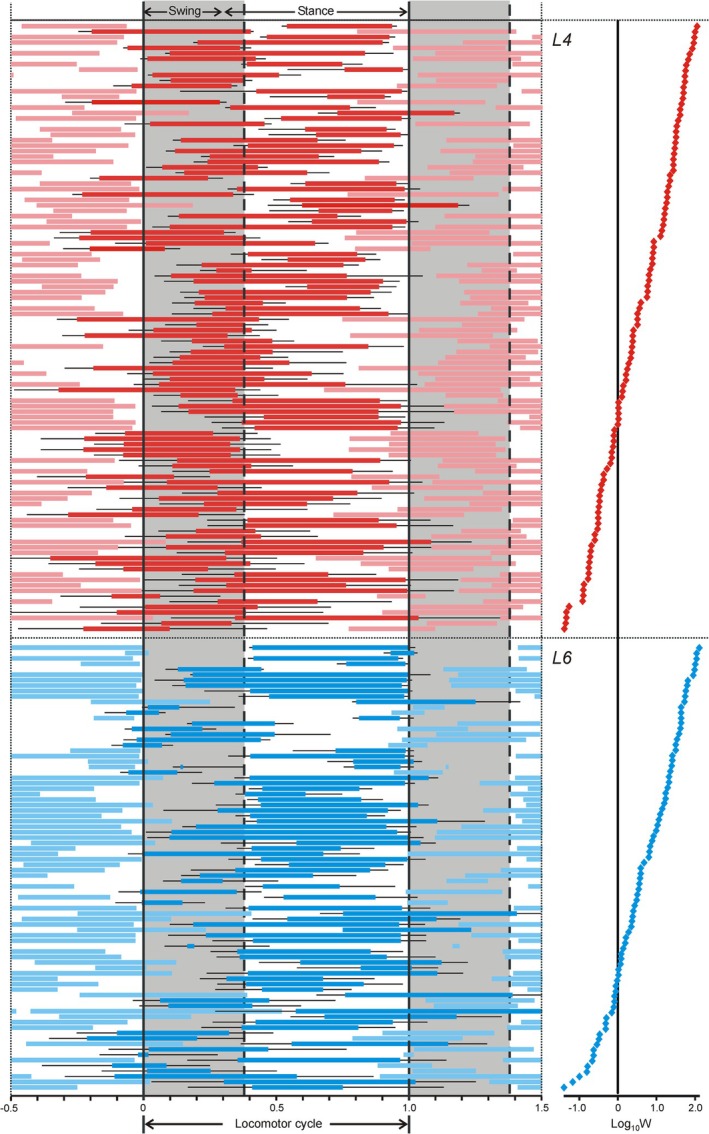
Locomotion is a vital motor function for any living being. In vertebrates, a basic locomotor pattern is controlled by the spinal locomotor network (SLN). Although SLN has been extensively studied, due to technical difficulties, most data were obtained during fictive locomotion, and data about the activity of spinal neurons during locomotion with intact sensory feedback from limbs are extremely limited. Here, we overcame the technical problems and recorded the activity of putative spinal interneurons from spinal segments L4-L6 during treadmill forward locomotion evoked by stimulation of the mesencephalic locomotor region in the decerebrate cat. We found that neurons were activated and inactivated preferably within one of the four phase ranges presumably related to preparation for the limb lift-off, the limb lift-off, transition from the limb flexion to limb extension during swing, and the limb touch-down. We analyzed the activity phases of recorded interneurons by using a new method that took into account the previously ignored information about the stability of neuronal modulation in the sequential locomotor cycles. We suggested that neurons with stable modulation (i.e., small dispersion of their activity phase in sequential cycles) represent the core of SLN. Our analysis revealed groups of neurons active approximately out of phase and presumably contributing to the control of vertical (VC) and horizontal (HC) components of the step. We found that most VC- and HC-related neurons were located in the intermediate and dorsal/ventral parts of the grey matter, respectively. Our experimental data can be used as a benchmark for computational models of locomotor neuronal networks.
Keywords: decerebrate cat; locomotion; mesencephalic locomotor region; neuronal network; spinal cord; spinal neurons.
© 2025 The Author(s). European Journal of Neuroscience published by Federation of European Neuroscience Societies and John Wiley & Sons Ltd.
Conflict of interest statement
The authors declare no conflicts of interest.
Figures


Similar articles
-
Functional organization of the spinal locomotor network based on analysis of interneuronal activity.bioRxiv [Preprint]. 2025 May 10:2025.05.06.652406. doi: 10.1101/2025.05.06.652406. bioRxiv. 2025. PMID: 40654692 Free PMC article. Preprint.
-
Prescription of Controlled Substances: Benefits and Risks.2025 Jul 6. In: StatPearls [Internet]. Treasure Island (FL): StatPearls Publishing; 2025 Jan–. 2025 Jul 6. In: StatPearls [Internet]. Treasure Island (FL): StatPearls Publishing; 2025 Jan–. PMID: 30726003 Free Books & Documents.
-
Simultaneous control of forward and backward locomotion by spinal sensorimotor circuits.J Physiol. 2024 Jan;602(1):183-204. doi: 10.1113/JP285473. Epub 2023 Nov 28. J Physiol. 2024. PMID: 38016922
-
Drugs for preventing postoperative nausea and vomiting in adults after general anaesthesia: a network meta-analysis.Cochrane Database Syst Rev. 2020 Oct 19;10(10):CD012859. doi: 10.1002/14651858.CD012859.pub2. Cochrane Database Syst Rev. 2020. PMID: 33075160 Free PMC article.
-
Interventions for central serous chorioretinopathy: a network meta-analysis.Cochrane Database Syst Rev. 2025 Jun 16;6(6):CD011841. doi: 10.1002/14651858.CD011841.pub3. Cochrane Database Syst Rev. 2025. PMID: 40522203
References
-
- Aoi, S. , Kondo T., Hayashi N., et al. 2013. “Contributions of Phase Resetting and Interlimb Coordination to the Adaptive Control of Hindlimb Obstacle Avoidance During Locomotion in Rats: A Simulation Study.” Biological Cybernetics 107: 201–216. - PubMed
-
- Baev, K. V. , Degtyarenko A. M., Zavadskaya T. V., and Kostyuk P. G.. 1979. “Activity of Interneurons of the Lumbar Region of the Spinal Cord During Fictive Locomotion of Thalamic Cats.” Neir̆ofiziologiia 11: 329–338. - PubMed
-
- Batschelet, E. 1981. Circular Statistics in Biology. Academic Press.
MeSH terms
Grants and funding
LinkOut - more resources
Full Text Sources
Miscellaneous
