. 2025 Aug 19;17(16):2693.
doi: 10.3390/cancers17162693.

Tumor-Specific EphA2 Receptor Tyrosine Kinase Inhibits Anti-Tumor Immunity by Recruiting Suppressive Myeloid Populations in Murine Models of Non-Small Cell Lung Cancer

Affiliations

Tumor-Specific EphA2 Receptor Tyrosine Kinase Inhibits Anti-Tumor Immunity by Recruiting Suppressive Myeloid Populations in Murine Models of Non-Small Cell Lung Cancer

Eileen Shiuan et al. Cancers (Basel). .

Abstract

Background: EphA2 is a receptor tyrosine kinase that contributes to tumor growth and metastasis and has been identified as a viable target for many solid cancers. Investigating EphA2's impact on the host immune system may advance our understanding of tumor immune evasion and the consequences of targeting EphA2 on the tumor microenvironment.

Methods: Here, we examine how tumor-specific EphA2 affects the activation and infiltration of immune cell populations and the cytokine and chemokine milieu in murine models of non-small cell lung cancer (NSCLC).

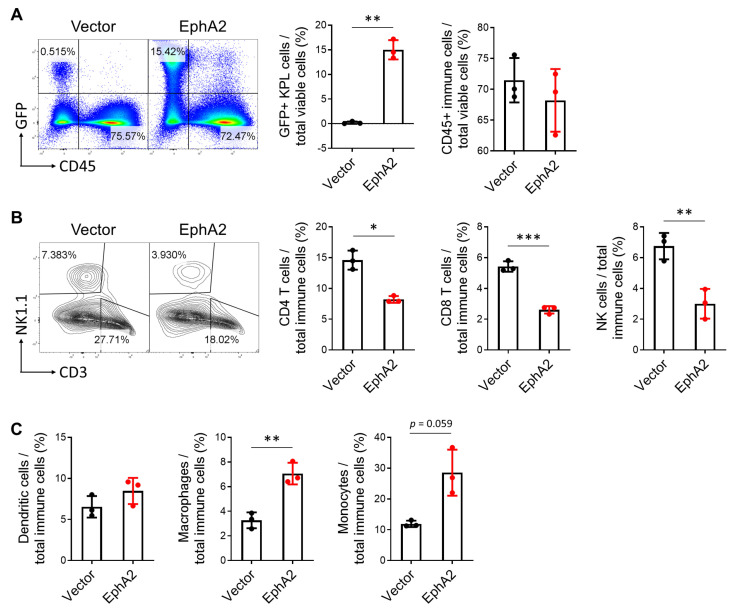
Results: Although EphA2 overexpression in NSCLC cells did not display proliferative advantage in vitro, it conferred a growth advantage in vivo. Analysis of lung tumor infiltrates via flow cytometry revealed decreased natural killer and T cells in the EphA2-overexpressing tumors, as well as increased myeloid populations, including tumor-associated macrophages (TAMs). T-cell activation, particularly in CD8+ T cells, was decreased, while PD-1 expression was increased. These changes were accompanied by increased monocyte-attracting chemokines, specifically CCL2, CCL7, CCL8, and CCL12, and immunosuppressive proteins TGF-β and arginase 1 in RNA expression analyses.

Conclusions: Our studies suggest EphA2 on tumor cells recruits monocytes and promotes their differentiation into TAMs that likely inhibit the activation and infiltration of cytotoxic lymphocytes, promoting tumor immune escape.

Keywords: EphA2; anti-tumor immunity; non-small cell lung cancer.


Conflict of interest statement

The authors declare no conflicts of interest.

Figures

Figure 1
Figure 1
EphA2 confers growth advantage to NSCLC in vivo but not in vitro. (A) Confirmation of EphA2 overexpression in KPL and LLC cells by western blot. (B,C) In vitro cell viability of KPL and LLC cells with control and EphA2 overexpression by MTT and colony formation assays (n = 4). (D) Representative image of bioluminescence signal in control and EphA2-overexpressing KPL tumors 14 days after subcutaneous implantation. (E) Representative image of bioluminescence signal 14 days after tail vein injection of control and EphA2-overexpressing KPL cells and quantification of bioluminescence signal at indicated time points (** p < 0.01, two-way ANOVA) (F) Representative gross specimens of GFP+ vector and EphA2-overexpressing KPL tumor-bearing lungs. (G) Survival of mice injected with vector or EphA2-overexpressiong KPL cells via tail vein (** p < 0.01, log-rank test). Data shown are averages ± SD.
Figure 2
Figure 2
EphA2 overexpression in NSCLC does not significantly impact tumor burden or immune infiltration in nude mice. (A) Tumor volumes over time and weights on day 14 post-implantation of control and EphA2-overexpressing KPL subcutaneous tumors from nude mice. (B) Flow cytometric analysis of GFP+ KPL tumor cells and total tumor-infiltrating immune cells, as well as (C) tumor-infiltrating NK cells, B cells, DCs, macrophages, and Gr1+ myeloid cells. (D) Similar flow cytometry analysis of immune populations from draining inguinal lymph nodes. Data shown are averages ± SD (n = 4 mice per group).
Figure 3
Figure 3
EphA2 overexpression in NSCLC decreases lymphocytic and increases myeloid infiltrate in tumor-bearing lungs. (A) Representative flow cytometry plots and quantification of GFP+ KPL and immune cells from vector control and EphA2-overexpressing tumor-bearing lungs on day 14 post-tail vein injection. (B) Similar flow plots and analysis of CD4+ and CD8+ T cells and NK cells, as well as (C) quantification of DCs, macrophages, and monocytes. Data shown are averages ± SD (n = 3 mice per group, * p < 0.05; ** p < 0.01; *** p < 0.001, two-tailed unpaired Student’s t test with Welch correction).
Figure 4
Figure 4
EphA2 overexpression in NSCLC suppresses tumor-infiltrating T cells. (A) Lung weights and quantification of GFP+ KPL cells via flow cytometry from vector control and EphA2-overexpressing tumor-bearing lungs with equalized tumor burden. (B) Flow cytometric analysis of total immune cells, CD4+ and CD8+ T cells, and NK cells in KPL tumor-bearing lungs. (C) Representative flow histograms of CD44 and CD69 expression on CD8 T cells and quantification of CD44, CD69, and CD25 activation markers on CD4 and CD8 T cells. (D) Quantification of PD-1 and CTLA-4 exhaustion markers on CD4+ and CD8+ T cells. Data shown are averages ± SD (n = 3–6 mice per group, * p < 0.05; ** p < 0.01, two-tailed unpaired Student’s t test with Welch correction).
Figure 5
Figure 5
Gene expression profiling reveals higher expression of myeloid markers and chemoattractants in EphA2-overexpressing tumors. (A) Average pathway scores of vector control and EphA2-overexpressing KPL tumors calculated from normalized gene expression data using nanoString nSolver software. (B) Comparison of cancer progression and macrophage functions pathway scores between control and EphA2-overexpressing samples. (n = 6 mice per group, ** p < 0.01, unpaired Mann-Whitney test) (C) Volcano plot of statistically significant differentially expressed genes. (D) Heatmap depicting standardized expression of differentially expressed myeloid markers (green bar), myeloid-attracting chemokines (pink bar), and immunosuppressive proteins (yellow bar). (E) RT-PCR validation of nanoString hits. (n = 6 mice per group, * p < 0.05, one-sample Wilcoxon signed rank test). Data shown are averages ± SD.

Similar articles

References

    1. Bergholz J.S., Wang Q., Kabraji S., Zhao J.J. Integrating Immunotherapy and Targeted Therapy in Cancer Treatment: Mechanistic Insights and Clinical Implications. Clin. Cancer Res. 2021;26:5557–5566. doi: 10.1158/1078-0432.CCR-19-2300. - DOI - PMC - PubMed
    1. Goswami S., Pauken K.E., Wang L., Sharma P. Next-Generation Combination Approaches for Immune Checkpoint Therapy. Nat. Immunol. 2024;25:2186–2199. doi: 10.1038/s41590-024-02015-4. - DOI - PubMed
    1. Siegel R.L., Kratzer T.B., Giaquinto A.N., Sung H., Jemal A. Cancer Statistics, 2025. CA Cancer J. Clin. 2025;75:10–45. doi: 10.3322/caac.21871. - DOI - PMC - PubMed
    1. Meyer M.L., Fitzgerald B.G., Paz-Ares L., Cappuzzo F., Jänne P.A., Peters S., Hirsch F.R. New Promises and Challenges in the Treatment of Advanced Non-Small-Cell Lung Cancer. Lancet. 2024;404:803–822. doi: 10.1016/S0140-6736(24)01029-8. - DOI - PubMed
    1. Toracchio L., Carrabotta M., Mancarella C., Morrione A., Scotlandi K. EphA2 in Cancer: Molecular Complexity and Therapeutic Opportunities. Int. J. Mol. Sci. 2024;25:12191. doi: 10.3390/ijms252212191. - DOI - PMC - PubMed

LinkOut - more resources