. 2025 Aug 19;17(16):2695.
doi: 10.3390/cancers17162695.

Unraveling the Clinical Landscape of RNA Modification Regulators with Multi-Omics Insights in Pan-Cancer

Affiliations

Unraveling the Clinical Landscape of RNA Modification Regulators with Multi-Omics Insights in Pan-Cancer

Qingman Li et al. Cancers (Basel). .

Abstract

Background/Objectives: Cancer remains a major global health challenge, with RNA modifications increasingly recognized as key regulators of tumor progression. However, integrated pan-cancer analyses across multiple modification types are limited. Methods: We performed a comprehensive analysis of 170 RNA modification-related genes across 33 cancer types, uncovering diverse expression, mutation, and epigenetic patterns. Results: Key regulators such as IGF2BP3, CFI, and ELF3 showed cancer-specific prognostic significance. We developed an RNA Modification Score (RMS) with strong prognostic performance (AUC up to 0.92), correlating with the tumor stage, immune infiltration, and immunotherapy response. High-risk groups exhibited immune checkpoint dysregulation and enriched M1 macrophages in glioblastoma. Drug screening highlighted oncrasin-72 as a potential therapy. Validation via single-cell/spatial transcriptomics and immunohistochemistry confirmed the spatial localization of critical genes like CFI and ELF3. Conclusions: Our study reveals the multifaceted role of RNA modifications in cancer, providing a translational framework for personalized prognosis and therapy in precision oncology.

Keywords: RNA modifications; pan-cancer analysis; precision oncology; prognostic model; tumor microenvironment.


Conflict of interest statement

All the authors declare that they have no conflicts of interest.

Figures
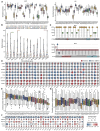
Figure 1
Figure 1
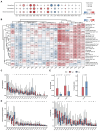
Expression and genomic landscape of RNA modification genes across 33 cancer types. (A) Normalized expression levels (TPM) of ELF3 and CFI across 33 cancers. (B) Mutation frequencies of RNA modification genes (mutation frequency × 100). The top 13 genes are displayed. (C) Mutation site distribution of TET1 and ELF3 across cancers. (D) Copy number variation (CNV) profiles of selected RNA modification genes. (E) Spearman correlation analysis between CNV and RNA modification gene expression (median coefficient > 0). (F) Methylation levels (beta-value) and standard deviation (SD) for TET2, NUDT21, PABPN1, FIP1L1, and CTU1. (G) Correlation between methylation and RNA modification gene expression (Spearman r < 0).
Figure 2
Figure 2
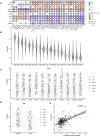
RMS construction and its clinical relevance. (A) Integration of differential expression analysis and LASSO regression for key gene screening. * indicates coefficients with absolute values > 0. (B) Statistical display of key RNA modification regulatory protein (upper) and RNA modification types (lower). (C) Area under the ROC curve (AUC) of RMS. Dashed line indicates AUC = 0.50. (D) Survival analysis validation of RMS (univariate Cox regression and Kaplan–Meier survival analysis). Dashed line indicates log-rank p value < 0.05. (E) Chi-square test for correlation between clinical stage and risk RMS groups. (F) Differential expression analysis based on risk RMS groups. (G) KEGG pathway ORA analysis between risk RMS groups in 19 cancers.
Figure 3
Figure 3
Integrative multi-algorithm analysis of the association between the RMS and the TIME. (A) Correlation analysis of RMS with ImmuneScore, StromalScore, and MicroenvironmentScore (quantified by xCell algorithm). (B) Spearman correlation heatmap between the RMS and the infiltration levels of 28 immune cell types (quantified by ssGSEA algorithm). Statistical significance was assessed using a two-tailed asymptotic t-test with Holm–Bonferroni correction. * p < 0.05, ** p < 0.01; *** p < 0.001. (C) Differences in immune infiltration levels of macrophages M1 cells (quantified by quanTIseq algorithm) between the risk RMS groups across 19 cancers (ns: not statistically significant). * p < 0.05, ** p < 0.01; *** p < 0.001, **** p < 0.0001. (D) Differences in the immune infiltration levels of Common.lymphoid.progenitor (left) and T.cell.CD4.Th2 cells (right) (from TIMER database) between the risk RMS groups across 19 cancers (ns: not statistically significant). * p < 0.05, ** p < 0.01; *** p < 0.001, **** p < 0.0001. (E) Differences in the immune infiltration levels of NK.cell.resting cells in GBM and HNSC (left), and T.cell.gamma.delta cells in THYM (right) (from TIMER database) between the risk RMS groups.
Figure 4
Figure 4
Potential roles of the RMS in tumor immunotherapy and signaling pathways. (A) Differential analysis of immune checkpoint molecules between the risk RMS groups across 19 cancers (Wilcoxon test; dashed line indicates adjusted p value < 0.05). (B) Spearman correlation heatmap between the RMS and the expression levels of immune checkpoint molecules. (C) Comparison of the TIDE scores between the risk RMS groups (Wilcoxon test; ns: not statistically significant). * p < 0.05, ** p < 0.01, **** p < 0.0001. (D) GSCA signaling pathway analysis between risk RMS groups in 18 cancers.
Figure 5
Figure 5
Drug sensitivity analysis of cancers highly correlated with the RMS. (A) Top 30 drugs potentially linked to genes (ELF3, NUDT16, CFI, IGF2BP2, PABPN1, ADAR, LSM7, FBL, PUS1, ADARB2) via GSCALite analysis. (B) Spearman correlation between the RMS and the predicted IC50 values of drugs across cancer types. (C) Distribution plot of the Spearman correlations between drugs (with RMS-IC50 correlation > 0.6) and RNA modification genes in THYM. (D) Distribution plot of the Spearman correlations between drugs (with RMS-IC50 correlation > 0.6) and RNA modification genes in KIRC. (E) Spearman correlation between the IC50 values of drug 743,380 (oncrasin-72) and PABPN1 expression.
Figure 6
Figure 6
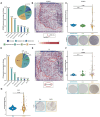
Single-cell, spatial transcriptomic, and immunohistochemical analyses of IGF2BP3, CFI, and ELF3 in GBM and SKCM. (A) Distribution of IGF2BP3 across cell clusters in GBM via single-cell RNA sequencing. The inserted pie plot displays the relative distribution ratio. (B) Spatial transcriptomic mapping reveals the IGF2BP3 expression distribution across the GBM specimen. (C) Immunohistochemistry slides and quantitative immunoreactivity scores for the IGF2BP3 protein are shown, with statistical significance evaluated by a one-tailed Student’s t-test. (D) Distribution of CFI across cell clusters in GBM via single-cell RNA sequencing. The inserted pie plot displays the relative distribution ratio. (E) Spatial transcriptomic mapping reveals the CFI expression distribution across the GBM specimen. (F) Immunohistochemistry slides and quantitative immunoreactivity scores for the CFI protein are shown, with statistical significance evaluated by a one-tailed Student’s t-test. (G) Immunohistochemistry slides and quantitative immunoreactivity scores for the ELF3 protein, with statistical significance evaluated by a one-tailed Student’s t-test.

Similar articles

References

    1. Bray F., Laversanne M., Sung H., Ferlay J., Siegel R.L., Soerjomataram I., Jemal A. Global cancer statistics 2022: GLOBOCAN estimates of incidence and mortality worldwide for 36 cancers in 185 countries. CA Cancer J. Clin. 2024;74:229–263. doi: 10.3322/caac.21834. - DOI - PubMed
    1. Siegel R.L., Giaquinto A.N., Jemal A. Cancer statistics, 2024. CA Cancer J. Clin. 2024;74:12–49. doi: 10.3322/caac.21820. - DOI - PubMed
    1. The Cancer Genome Atlas Research Network. Weinstein J.N., Collisson E.A., Mills G.B., Shaw K.R., Ozenberger B.A., Ellrott K., Shmulevich I., Sander C., Stuart J.M. The Cancer Genome Atlas Pan-Cancer analysis project. Nat. Genet. 2013;45:1113–1120. doi: 10.1038/ng.2764. - DOI - PMC - PubMed
    1. Marx V. Closing in on cancer heterogeneity with organoids. Nat. Methods. 2024;21:551–554. doi: 10.1038/s41592-024-02231-8. - DOI - PubMed
    1. Wang D., Liu B., Zhang Z. Accelerating the understanding of cancer biology through the lens of genomics. Cell. 2023;186:1755–1771. doi: 10.1016/j.cell.2023.02.015. - DOI - PubMed

LinkOut - more resources