. 2025 Aug 1;15(8):1110.
doi: 10.3390/biom15081110.

Piezo1 Channel Activators Yoda1 and Yoda2 in the Context of Red Blood Cells

Affiliations

Piezo1 Channel Activators Yoda1 and Yoda2 in the Context of Red Blood Cells

Min Qiao et al. Biomolecules. .

Abstract

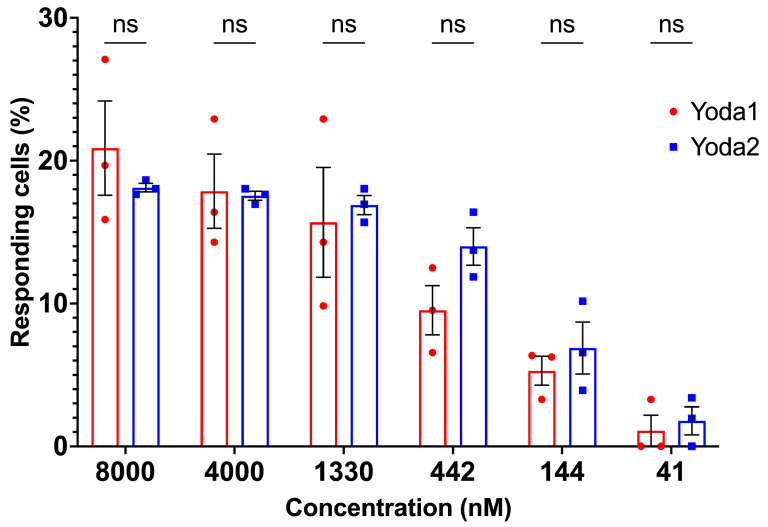
Piezo1 is a mechanosensitive non-selective cation channel. Genetic alterations of the channel result in a hematologic phenotype named Hereditary Xerocytosis. With Yoda1 and, more recently, Yoda2, compounds to increase the activity of Piezo1 have become available. However, their concrete effect depends on the nano environment of the channel and hence on the cell type. Here we compare the potency of Yoda1 and Yoda2 in red blood cells (RBCs). We investigate the effect of the compounds on direct channel activity using automated patch clamp, as well as the secondary effects of channel activation on signalling molecules and cellular response. In terms of signalling, we investigate the temporal response of the second messenger Ca2+, and in terms of cellular response, the activity of the Gárdos channel. The opening of the Gárdos channel leads to a hyperpolarisation of the RBCs, which is measured by the Macey-Bennekou-Egée (MBE) method. Although the interpretation of the data is not straightforward, we discuss the results in a physiological context and provide recommendations for the use of Yoda1 and Yoda2 to investigate RBCs.

Keywords: MBE-method; Piezo1; Yoda1; Yoda2; automated patch-clamp; erythrocytes; intracellular calcium; live cell imaging; mechanosensitive ion channel; membrane potential.


Conflict of interest statement

The funders had no role in the design of the study; in the collection, analysis, or interpretation of data; in the writing of the manuscript; or in the decision to publish the results. RP, NM, and MGR are employees of Nanion Technologies, the manufacturer of the device used for the acquisition of the data presented in Figure 1 and Figure A1.

Figures

Figure A1
Figure A1
The responding cells at +80 mV of Piezo1 agonists Yoda1 and Yoda2 recorded using automated patch clamp. Yoda1: 8000 nM: n = 35/172; 4000 nM: n = 30/172; 1330 nM: n = 26/172; 442 nM: n = 16/172; 144 nM: n = 9/172; 41 nM: n = 2/172; N = 3; Yoda2: 8000 nM: n = 31/171; 4000 nM: n = 30/171; 1330 nM: n = 30/171; 442 nM: n = 24/171; 144 nM: n = 12/171; 41 nM: n = 3/171; N = 3. The bars are mean ± SEM, indicated in black; the circles are the data points from individual experiments. The fraction of cells responding to Yoda1 increased with concentration, mirroring the concentration–response relationship. In contrast, the fraction of cells responding to Yoda2 increased progressively with concentrations up to 1300 nM, after which current amplitudes plateaued or slightly decreased, hence no longer meeting the criteria for responding cells at the highest concentrations. This accounts for the variability between the total number of cells classified as responders across the full range of Yoda2 concentrations (n = 35) and the number of cells responding at the highest concentration (n = 31). n represents the number of cells at any tested concentration for a given experimental condition out of the total number of valid cells, and N indicates the number of independent experiments.
Figure A2
Figure A2
Representative normalised histograms of Fluo-4 intensity of RBCs after Yoda1 stimulation over time. The concentration of Yoda1 is indicated in each panel.
Figure A3
Figure A3
Representative normalised histograms of Fluo-4 intensity of RBCs after Yoda2 stimulation over time. The concentration of Yoda2 is indicated in each panel.
Figure A4
Figure A4
Average Fluo-4 intensity of all red blood cells (RBCs) over time after (A) Yoda1 and (B) Yoda2 stimulation. Data are shown as means ± SEM. (N = 3 independent experiments, n > 30,000 cells per time interval).
Figure 1
Figure 1
Comparative analysis of Piezo1 activators Yoda1 and Yoda2 using automated patch clamp. (A,B) Representative current ramp traces recorded from human RBCs. Voltage ramps from −100 mV to +80 mV (insets) were applied every 10 s. Cells were initially perfused with external solution (grey traces), followed by cumulative additions of Yoda1 (A; 41 nM, 144 nM, 442 nM, 1330 nM, 4000 nM, and 8000 nM; red traces) or Yoda2 (B; 41 nM, 144 nM, 442 nM, 1330 nM, 4000 nM, and 8000 nM; blue traces). Subsequently, 30 μM GdCl3 was applied to block Piezo1 channels (black traces). (C,D) Time-course plots of current amplitudes at +80 mV from representative cells exposed to cumulative applications of external solution (C,D, grey traces), increasing solutions of Yoda1 (C, red traces) or Yoda2 (D, blue traces), and GdCl3 (C,D, black traces). Dashed vertical lines indicate the time points of each solution addition. (E) Concentration–response curves for Yoda1 and Yoda2. Current amplitudes at +80 mV were normalised to the baseline current in the external solution (I/IREF). Data points represent mean ± SEM. Curves were fitted using the Hill equation to estimate the EC50s. These data were obtained from the subset of RBCs classified as responders, defined as RBCs in which the current amplitude in the presence of the compound at any concentration exceeded the baseline current by more than three times the standard deviation (3σ) of the baseline. The EC50 values were determined to be 1391 nM for Yoda1 (n = 35/172; N = 3) and 305 nM for Yoda2 (n = 35/171; N = 3), indicating a higher potency and efficiency of Yoda2 in activating the Piezo1 channel. Here, n represents the number of responding cells out of the total number of cells that met the preset quality control conditions, and N indicates the number of independent NPC-384 well plates.
Figure 2
Figure 2
Comparison of action of Yoda1 and Yoda2 on the free Ca2+ in healthy red blood cells (RBCs). (A) Representative normalised histograms of Fluo-4 intensity of unstained RBCs (gray), Fluo-4-stained RBCs in Tyrode solution (black), Fluo-4-stained RBCs with Yoda1 stimulation (red), and Fluo-4-stained RBCs with Yoda2 stimulation (blue). (B) Maximum Fluo-4 intensity during recording for each compound was used to construct fitted curves from the Hill equation, and the respective EC50 values are indicated. (C,D) Representative normalised histograms of Fluo-4 intensity of RBCs after 5120 nM Yoda1 (C) and Yoda2 (D) stimulation. Histograms for all concentrations applied are provided in Appendix B. (E,F) Three-dimensional presentation of fitted curves from the Hill equation by using the average Fluo-4 intensity of RBCs after Yoda1 (E) and Yoda2 (F) stimulation over time. (G,H) Percentage of the high Ca2+ RBC population over time after Yoda1 (G) and Yoda2 (H) stimulation. Data are shown as means ± SEM in panels (B,G,H). (N = 3 independent experiments with at least 30,000 cells per time interval).
Figure 2
Figure 2
Comparison of action of Yoda1 and Yoda2 on the free Ca2+ in healthy red blood cells (RBCs). (A) Representative normalised histograms of Fluo-4 intensity of unstained RBCs (gray), Fluo-4-stained RBCs in Tyrode solution (black), Fluo-4-stained RBCs with Yoda1 stimulation (red), and Fluo-4-stained RBCs with Yoda2 stimulation (blue). (B) Maximum Fluo-4 intensity during recording for each compound was used to construct fitted curves from the Hill equation, and the respective EC50 values are indicated. (C,D) Representative normalised histograms of Fluo-4 intensity of RBCs after 5120 nM Yoda1 (C) and Yoda2 (D) stimulation. Histograms for all concentrations applied are provided in Appendix B. (E,F) Three-dimensional presentation of fitted curves from the Hill equation by using the average Fluo-4 intensity of RBCs after Yoda1 (E) and Yoda2 (F) stimulation over time. (G,H) Percentage of the high Ca2+ RBC population over time after Yoda1 (G) and Yoda2 (H) stimulation. Data are shown as means ± SEM in panels (B,G,H). (N = 3 independent experiments with at least 30,000 cells per time interval).
Figure 3
Figure 3
Exemplified microscopy analysis of Ca2+ signalling of healthy red blood cells (RBCs) with 1.28 μM Yoda1 or Yoda2 stimulation. (A) The cellular Ca2+ response was plotted as average Fluo-4 intensity over time for all RBCs (N = 2 independent experiments, each of n > 50 cells). (BE) Confocal images of RBCs at different conditions: (B) unstained RBCs; (C) Fluo-4-stained RBCs in Tyrode solution; the inset is intensity amplified to visualise the cells; (D) Fluo-4-stained RBCs after Yoda1 stimulation with temporal information indicated below the images; (E) Fluo-4-stained RBCs after Yoda2 stimulation with temporal information indicated below the images. The scale bar given in (B) is valid for all images, and all images had the same acquisition settings and are displayed in the same contrast settings, except the insert in panel (C).
Figure 4
Figure 4
The comparison of Piezo1 activators Yoda1 and Yoda2 in a population of healthy red blood cells (RBCs) using the MBE method. (A) Representative recordings of membrane potential (Vm) changes in RBCs upon exposure to 640 nM Yoda1 (red) and Yoda2 (blue). Recording starts at the resting membrane potential (Vrest) of RBCs. The trace shows the addition of the reagent—Yoda1 or Yoda2—as well as the addition of Triton-X at the end so as to lyse the cells (reference point 0 mV). (B) Dose–response curves for Yoda1 and Yoda2, showing the effect of varying concentrations of the reagents. For each concentration, the magnitude of membrane hyperpolarisation ΔVm is obtained from the average of two or more measurements from different donors. The Hill equation is used to fit curves to the data. The respective EC50 values for Yoda1 and Yoda2 are indicated on the plot. (C) Representation of the dose dependency of the slope in RBC samples after the addition of reagents. The slope is determined by identifying the membrane potential values at one-third and two-thirds of the range between the resting membrane potential and the peak membrane potential. Specifically, the slope is calculated as (Vb − Va)/(Tb − Ta), where Va and Vb are the membrane potentials at one-third and two-thirds of the range, respectively, and Ta and Tb are the corresponding time points. This reflects the rate of hyperpolarisation within the central portion of the response curve. (D,E) Three-dimensional waterfall plot displaying representative traces of membrane potential changes in RBCs following exposure to varying concentrations of Yoda1 and Yoda2. Data are expressed as mean ± SEM.
Figure 5
Figure 5
(AC) Graphs representing the biological variability of samples as a means to determine that variation of results during experiments is sample-dependent and not mechanical error. Samples from three donors were measured under identical conditions to ensure consistency in the results. (A) Scatter plot showing ΔVm of red blood cells (RBCs) exposed to five different concentrations of Yoda2. (B) Bar graph comparing the Vrest of three different donors. ** indicate a significance p < 0.01 and ns p > 0.05. (C) Representation of the dose dependency of the slope in RBC samples after addition of different concentrations of Yoda1 and Yoda2. Statistical significance in the graphs was determined using ordinary one-way ANOVA. Data are expressed as mean ± SEM. Significant differences between groups were considered at p < 0.05. All experiments were conducted under identical conditions and on the same day in order to ensure that observed variability arose solely from biological differences between samples rather than external or mechanical inconsistencies.

References

    1. Coste B., Mathur J., Schmidt M., Earley T.J., Ranade S., Petrus M.J., Dubin A.E., Patapoutian A. Piezo1 and Piezo2 Are Essential Components of Distinct Mechanically Activated Cation Channels. Science. 2010;330:55–60. doi: 10.1126/science.1193270. - DOI - PMC - PubMed
    1. Coste B., Xiao B., Santos J.S., Syeda R., Grandl J., Spencer K.S., Kim S.E., Schmidt M., Mathur J., Dubin A.E., et al. Piezo Proteins Are Pore-Forming Subunits of Mechanically Activated Channels. Nature. 2012;483:176–181. doi: 10.1038/nature10812. - DOI - PMC - PubMed
    1. Ranade S.S., Qiu Z., Woo S.-H., Hur S.S., Murthy S.E., Cahalan S.M., Xu J., Mathur J., Bandell M., Coste B., et al. Piezo1, a Mechanically Activated Ion Channel, Is Required for Vascular Development in Mice. Proc. Natl. Acad. Sci. USA. 2014;111:10347–10352. doi: 10.1073/pnas.1409233111. - DOI - PMC - PubMed
    1. Gudipaty S.A., Lindblom J., Loftus P.D., Redd M.J., Edes K., Davey C.F., Krishnegowda V., Rosenblatt J. Mechanical Stretch Triggers Rapid Epithelial Cell Division through Piezo1. Nature. 2017;543:118–121. doi: 10.1038/nature21407. - DOI - PMC - PubMed
    1. He L., Si G., Huang J., Samuel A.D.T., Perrimon N. Mechanical Regulation of Stem-Cell Differentiation by the Stretch-Activated Piezo Channel. Nature. 2018;555:103–106. doi: 10.1038/nature25744. - DOI - PMC - PubMed

Supplementary concepts

LinkOut - more resources