. 2025 Aug 1;15(8):1112.
doi: 10.3390/biom15081112.

Circulating Lipid Profiles Indicate Incomplete Metabolic Recovery After Weight Loss, Suggesting the Need for Additional Interventions in Severe Obesity

Affiliations

Circulating Lipid Profiles Indicate Incomplete Metabolic Recovery After Weight Loss, Suggesting the Need for Additional Interventions in Severe Obesity

Alina-Iuliana Onoiu et al. Biomolecules. .

Abstract

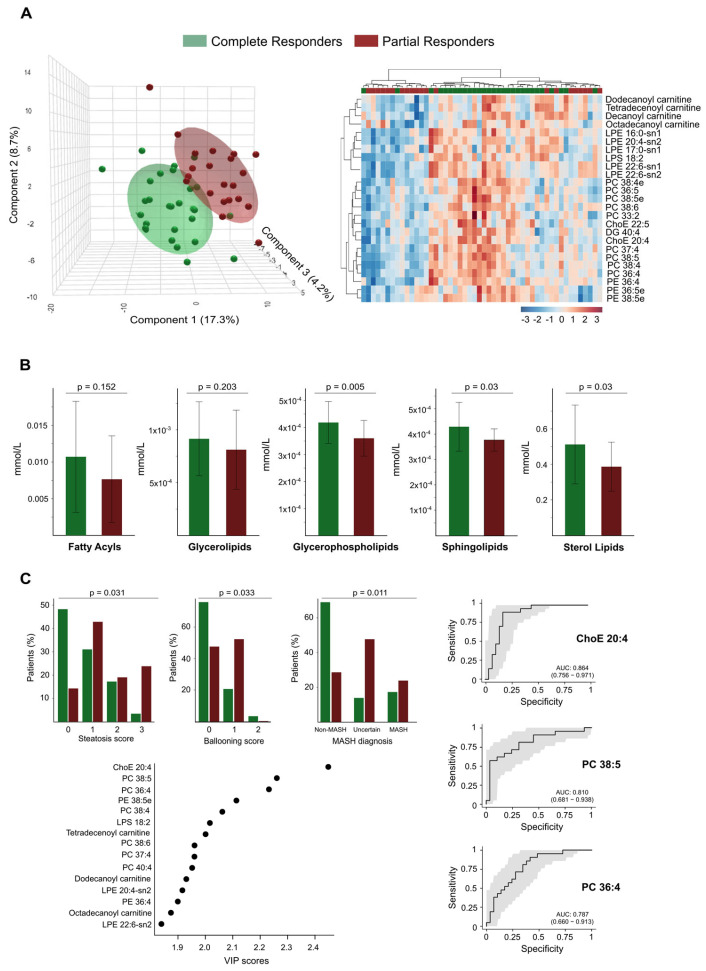
The effects of long-term adjustments in body weight on the lipid balance in patients with severe obesity are not well understood. This study aimed to evaluate a non-invasive lipidomic approach to identifying biomarkers that could help predict which patients may require additional therapies before and after weight loss. Using mass spectrometry, 275 lipid species were analysed in non-obese controls, patients with severe obesity, and patients one year after bariatric surgery. The results showed that severe obesity disrupts lipid pathways, contributing to lipotoxicity, inflammation, mitochondrial stress, and abnormal lipid metabolism. Although weight loss improved these disturbances, surgery did not fully normalise the lipid profiles of all patients. Outcomes varied depending on their baseline liver health and genetic differences. Persistent alterations in cholesterol handling, membrane composition, and mitochondrial function were observed in partial responders. Elevated levels of sterol lipids, glycerophospholipids, and sphingolipids emerged as markers of complete metabolic recovery, identifying candidates for targeted post-surgical interventions. These findings support the use of lipidomics to personalise obesity treatment and follow-up.

Keywords: biomarkers; fatty acid metabolism; lipidomics; metabolic surgery; obesity; oxylipins; precision medicine.


Conflict of interest statement

The authors declare no conflicts of interest. The funders had no role in the design of the study; in the collection, analyses, or interpretation of data; in the writing of the manuscript; or in the decision to publish the results.

Figures

Figure 1
Figure 1
Severe obesity induces significant changes in the circulating lipidome. (A) The bubble plot illustrates the magnitude and direction of lipid alterations across different classes in individuals with severe obesity compared to controls. (B) The Partial Least Squares Discriminant Analysis shows a clear distinction between the control group and individuals with severe obesity across various lipid classes, with fatty acyls and glycerophospholipids demonstrating the strongest ability to differentiate between the groups. (C) The volcano plot displays the individual lipids showing the greatest differences between groups, and the Receiver Operating Characteristic curves for the three most significantly altered species, highlight their potential as diagnostic indicators of metabolic stress. AUC: Area under the curve; FC: Fold change.
Figure 2
Figure 2
Class-specific lipid alterations and individual species expression patterns in severe obesity. The left side displays box plots comparing total lipid class concentrations between the severe obesity group and the control group. On the right, heatmaps illustrate the most differentially expressed lipid species within each lipid class, with hierarchical clustering showing distinct patterns of regulation. ChoE: Cholesterol ester; DG: Diglyceride; EpOME: Epoxide form of linoleic acid; HETE: Hydroxyeicosatetraenoic acid; LPC: Lysophosphatidylcholine; LPE: Lysophosphatidylethanolamine; PC: Phosphatidylcholine; SM: Sphingomyelin; TG: Triglyceride.
Figure 3
Figure 3
Surgery-induced weight loss partially restores changes in the circulating lipidome. (A) The bubble plot compares the alterations in lipid classes in individuals with severe obesity before and after weight loss, illustrating the extent of restoration in the circulating lipidome following bariatric surgery. (B) The volcano plot displays the individual lipids showing the greatest differences between groups. (C) Partial Least Squares Discriminant Analysis shows a clear separation between the groups, with fatty acyls providing the most significant differentiation. (D) Receiver Operating Characteristic curves demonstrate the potential of the most significantly altered lipid species as biomarkers following the bariatric intervention. AUC: Area under the curve; FC: Fold change; LPC: Lysophosphatidylcholine.
Figure 4
Figure 4
Comparisons in the circulating lipidome between post-surgical patients and control group confirm metabolic recovery. (A) The two groups show a modest separation in the Partial Least Squares Discriminant Analysis, with no lipid family exhibiting complete separation. (B) The bubble plot displays the magnitude and direction of remaining lipid alterations across families. (C) The volcano plot illustrates the differentially abundant lipids species between the two groups. (D) Receiver Operating Characteristic analysis highlights the top three discriminating lipid biomarkers, revealing residual alterations in lipid homeostasis. AUC: Area under the curve; FC: Fold change; HETE: Hydroxyeicosatetraenoic acid; SM: Sphingomyelin.
Figure 5
Figure 5
Post-bariatric surgery patients exhibit an intermediate lipidome profile between the control and severe obesity groups. The Partial Least Squares Discriminant Analysis on the left illustrates the trajectory of metabolic changes from the disease state to surgical intervention. The heatmap on the right displays the expression patterns of the most differentially regulated lipid species across all three groups, highlighting distinct clustering patterns. This analysis demonstrates both the metabolic disruption caused by severe obesity and the partial normalisation achieved through weight loss interventions. HETE: Hydroxyeicosatetraenoic acid; LPC: Lysophosphatidylcholine; PC: Phosphatidylcholine; SM: Sphingomyelin.
Figure 6
Figure 6
Lipidomic profiling differentiates complete from partial responders and correlates with histological and diagnostic features. (A) The Partial Least Squares Discriminant Analysis (on the left) and the heatmap (on the right) illustrate the distinct separation between complete responders and partial responders based on their plasma lipidomic profiles. The heatmap highlights the top discriminant lipid species. (B) Bar plots compare the abundances of lipid classes between complete and partial responders. Significant differences are observed in glycerophospholipids, sphingolipids, and sterol lipids. (C) The associations between lipidomic profiles and histological features, such as steatosis score, ballooning score, and metabolic dysfunction-associated steatohepatitis diagnosis, are also noted. A Variable Importance in the Projection (VIP) plot identifies the lipid species that contribute most to group separation. Receiver Operating Characteristic curves for key lipid species demonstrate strong diagnostic performance. AUC: Area under the curve; ChoE: Cholesterol ester; DG: Diglyceride; LPE: Lysophosphatidylethanolamine; PC: Phosphatidylcholine; PE: Phosphatidylethanolamine.

Similar articles

References

    1. Ellison-Barnes A., Johnson S., Gudzune K. Trends in obesity prevalence among adults aged 18 through 25 years, 1976–2018. JAMA. 2021;326:2073–2074. doi: 10.1001/jama.2021.16685. - DOI - PMC - PubMed
    1. UN . World Population Prospects 2024. United Nations, Department of Economic and Social Affairs, Population Division; New York, NY, USA: 2024. [(accessed on 17 June 2025)]. Online Edition. Available online: https://population.un.org/wpp/
    1. Rubino F., Cummings D.E., Eckel R.H., Cohen R.V., Wilding J.P.H., Brown W.A., Stanford F.C., Batterham R.L., Farooqi I.S., Farpour-Lambert N.J., et al. Definition and diagnostic criteria of clinical obesity. Lancet Diabetes Endocrinol. 2025;13:221–262. doi: 10.1016/S2213-8587(24)00316-4. - DOI - PMC - PubMed
    1. Yanovski S.Z., Yanovski J.A. Approach to obesity treatment in primary care: A review. JAMA Intern. Med. 2024;184:818–829. doi: 10.1001/jamainternmed.2023.8526. - DOI - PMC - PubMed
    1. Lin X., Li H. Obesity: Epidemiology, pathophysiology, and therapeutics. Front. Endocrinol. 2021;12:706978. doi: 10.3389/fendo.2021.706978. - DOI - PMC - PubMed