. 2025 Aug 8;15(8):1144.
doi: 10.3390/biom15081144.

Hypoxia Exacerbates Inflammatory Signaling in Human Coronavirus OC43-Infected Lung Epithelial Cells

Affiliations

Hypoxia Exacerbates Inflammatory Signaling in Human Coronavirus OC43-Infected Lung Epithelial Cells

Jarod Zvartau-Hind et al. Biomolecules. .

Abstract

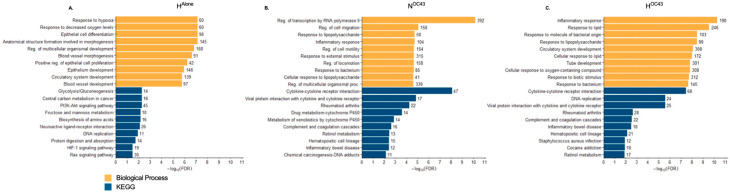
Cytokine storm (CS) is associated with poor prognosis in COVID-19 patients. Hypoxic signaling has been proposed to influence proinflammatory pathways and to be involved in the development of CS. Here, for the first time, the role of hypoxia in coronavirus-mediated inflammation has been investigated, using transcriptomic and proteomic approaches. Analysis of the transcriptome of A549 lung epithelial cells using RNA sequencing revealed 191 mRNAs which were synergistically upregulated and 43 mRNAs which were synergistically downregulated by the combination of human Betacoronavirus OC43 (HCoV-OC43) infection and hypoxia. Synergistically upregulated mRNAs were strongly associated with inflammatory pathway activation. Analysis of the expression of 105 cytokines and immune-related proteins using antibody arrays identified five proteins (IGFBP-3, VEGF, CCL20, CD30, and myeloperoxidase) which were markedly upregulated in HCoV-OC43 infection in hypoxia compared to HCoV-OC43 infection in normal oxygen conditions. Our findings show that COVID-19 patients with lung hypoxia may face increased risk of inflammatory complications. Two of the proteins we have identified as synergistically upregulated, the cytokines VEGF and CCL20, represent potential future therapeutic targets. These could be targeted directly or, based on the novel findings described here by inhibiting hypoxia signaling pathways, to reduce excessive inflammatory cytokine responses in patients with severe infections.

Keywords: CCL20; COVID-19; HCoV-OC43; IGFBP3; VEGF; cytokine storm; hypoxia; inflammation.


Conflict of interest statement

The authors declare no conflicts of interest.

Figures

Figure 1
Figure 1
Transcriptomic Profiling of RNA Sequencing Data from A549 Lung Epithelial Cells. (AC), Variation in significantly differentially expressed genes (DEGs) between RNA sequencing readouts from cells incubated in different experimental conditions (n = 4). The x-axis shows the condition group, and the y-axis represents the number of significantly (A) upregulated, (B) downregulated and (C) total DEGs compared to NAlone. Differential gene expression was analyzed using the DESeq2 R package. A gene was defined as significantly differentially expressed if p ≤ 0.05 (using the Wald test followed by a Benjamini–Hochberg correction for multiple testing) and if the log2 fold change was >1. (DG), Volcano plots showing the distribution of DEGs in A549 cells in (D) HAlone, (E) NOC43 and (F) HOC43, compared to NAlone. Volcano plot (G) shows DEGs in HOC43, compared to NOC43. Clinically relevant cytokine genes of interest are annotated in each volcano plot. The x-axis shows the log2 fold change in each gene and the y-axis shows the log10 (p-adjusted value) of each gene. Genes with a p-value less than 0.05 and a log2 fold change greater than 1 are indicated by blue dots. These represent upregulated genes. Genes with a p-value less than 0.05 and a log2 fold change less than −1 are indicated by yellow dots. These represent downregulated genes. Genes with a p-value greater than 0.05, or a log2 fold change less than one or greater than −1 are indicated by dark blue dots. These represent unchanged genes. All data is based on n = 4 independent biological repeats.
Figure 2
Figure 2
Gene Ontology of RNA Sequencing Data from A549 Lung Epithelial Cells. (AC), GO clustering of significantly DEGs in A549 lung epithelial cell RNA sequencing data. GO analysis was performed using ShinyGO v0.80, focusing on the BP and KEGG GO term databases. The analysis included DEGs under the three conditions: (A) HAlone, (B) NOC43, and (C) HOC43, each compared to NAlone. The top ten GO terms identified through this filtering and ranking process are displayed per condition. The x-axis shows the −log10 of the FDR (False Discovery Rate) values, with the more significant pathways having longer bars, per GO term. GO terms were filtered based on their false discovery rate (FDR) and then ranked by fold enrichment. Numbers at the end of each column indicate the number of genes regulated. All data is based on n = 4 biological repeats.
Figure 3
Figure 3
The most highly synergistically upregulated genes induced by HCoV-OC43 infection of A549 cells in hypoxia. (A) The top 20 genes showing the highest synergistic upregulation in response to HCoV-OC43 infection under hypoxic conditions (n = 4). For this study, synergistic gene upregulation was defined as upregulation more than two-fold higher in the presence of both hypoxia and HCoV-OC43 infection than the sum of fold changes by either condition alone. The fold changes shown are for HAlone, NOC43, and HOC43, normalized to NAlone. In total, 191 genes were identified as synergistically upregulated, including 133 protein-coding genes, 25 long non-coding RNAs (lncRNAs), 12 long intergenic non-coding RNAs (lincRNAs), 9 pseudogenes, and 12 undefined transcripts. (B) The bar chart displays the log2-transformed fold changes in mRNA levels for the top 20 synergistically upregulated genes in HOC43 (red), NOC43 (turquoise) and HAlone (gray). Statistical significance between NOC43 and HOC43 was assessed using a Wald test followed by Benjamini–Hochberg correction for multiple testing based on the DESeq2 differential analysis. Significance levels are indicated as follows: n/s = not significant, * = p < 0.05, ** = p < 0.01, *** = p < 0.001, **** = p < 0.0001. Complete data for all 191 synergistically upregulated genes are provided in Supplementary Materials File S1.
Figure 4
Figure 4
Top synergistically downregulated genes induced by HCoV-OC43 infection of A549 cells in hypoxia. (A) The top 20 genes showing the highest synergistic downregulation in response to HCoV-OC43 infection under hypoxic conditions (n = 4). For this study, synergistic gene downregulation was defined as a reduction in the number of transcripts by more than two-fold in the presence of both hypoxia and HCoV-OC43 infection than the sum of fold changes by either condition alone. The fold changes shown are for HAlone, NOC43, and HOC43, normalized to NAlone. In total, 43 genes were identified as synergistically downregulated, including 29 protein-coding genes, 5 lncRNAs, 7 lincRNAs, and 2 pseudogenes. (B) The bar chart displays the log2-transformed fold changes in mRNA levels for the top 20 synergistically downregulated genes in HOC43 (red), NOC43 (turquoise) and HAlone (gray). Statistical significance between NOC43 and HOC43 was assessed using a Wald test followed by Benjamini–Hochberg correction for multiple testing based on the DESeq2 differential analysis, but no genes were statistically significant. Complete data for all 44 synergistically regulated genes are provided in Supplementary Materials File S1.
Figure 5
Figure 5
Transcriptomic analysis of clinically relevant cytokine genes expressed by A549 cells. RNA sequencing data (n = 4) from A549 lung epithelial cells infected with HCoV-OC43 under normoxic and hypoxic conditions were compared to a curated list of clinically relevant cytokines identified from studies comparing serum cytokine levels in severely and mildly affected COVID-19 patients. A panel of cytokines was selected based on multiple studies that analyzed serum cytokine levels in COVID-19 patients with mild, severe or death cases, demonstrating elevated levels in those with more severe disease [7,8,9,10,11]. These cytokines were compared to the RNA sequencing data to assess whether hypoxia influences their levels of mRNA in lung epithelial cells during HCoV-OC43 infection. The displayed data represents the log2-transformed reads for each gene in HAlone (gray), NOC43 (turquoise), and HOC43 (red), normalized to NAlone. Statistical significance of differential expression between NOC43 and HOC43 was assessed using a Wald test followed by Benjamini–Hochberg correction for multiple testing, based on the DESeq2 differential analysis: ns = not significant, * = p < 0.05, *** = < 0.001, **** = < 0.0001.
Figure 6
Figure 6
Secreted/released cytokine, chemokine and immune-related protein expression in A549 lung epithelial cells infected with HCoV-OC43 under normoxic and hypoxic conditions. Protein levels were assessed using cytokine, chemokine and immune-related antibody arrays, analyzing pooled cell culture supernatant samples from the RNA sequencing experiments (n = 4 independent biological repeats). (A) shows the antibody arrays used to evaluate protein expression across the four experimental conditions. (BD) display the top 10 upregulated protein in each condition, normalized to NAlone. (E) highlights the expression of the five proteins—IGFBP-3, VEGF, CCL20, CD30 and MPO—that were upregulated by more than 1.5-fold in the HOC43 condition compared to the NOC43 condition. The color of the bars corresponds to the color-coded boxes on the antibody arrays. (F) IL-6 ELISA assay on pooled supernatant samples (n = 4).

Similar articles

References

    1. Frisoni P., Neri M., D'Errico S., Alfieri L., Bonuccelli D., Cingolani M., Di Paolo M., Gaudio R.M., Lestani M., Marti M., et al. Cytokine storm and histopathological findings in 60 cases of COVID-19-related death: From viral load research to immunohistochemical quantification of major players IL-1beta, IL-6, IL-15 and TNF-alpha. Forensic Sci. Med. Pathol. 2022;18:4–19. doi: 10.1007/s12024-021-00414-9. - DOI - PMC - PubMed
    1. Ferrara J.L., Abhyankar S., Gilliland D.G. Cytokine storm of graft-versus-host disease: A critical effector role for interleukin-1. Transplant. Proc. 1993;25:1216–1217. - PubMed
    1. Jarczak D., Nierhaus A. Cytokine Storm-Definition, Causes, and Implications. Int. J. Mol. Sci. 2022;23:11740. doi: 10.3390/ijms231911740. - DOI - PMC - PubMed
    1. Ramatillah D.L., Gan S.H., Pratiwy I., Syed Sulaiman S.A., Jaber A.A.S., Jusnita N., Lukas S., Abu Bakar U. Impact of cytokine storm on severity of COVID-19 disease in a private hospital in West Jakarta prior to vaccination. PLoS ONE. 2022;17:e0262438. doi: 10.1371/journal.pone.0262438. - DOI - PMC - PubMed
    1. Ryabkova V.A., Churilov L.P., Shoenfeld Y. Influenza infection, SARS, MERS and COVID-19: Cytokine storm—The common denominator and the lessons to be learned. Clin. Immunol. 2021;223:108652. doi: 10.1016/j.clim.2020.108652. - DOI - PMC - PubMed

MeSH terms

LinkOut - more resources