. 2025 Aug 18;15(8):1181.
doi: 10.3390/biom15081181.

Targeting HMGCS2: Ketogenesis Suppression Accelerates NAFLD Progression in T2DM Comorbidity, While Cynaroside Ameliorates NASH in Concomitant T2DM

Affiliations

Targeting HMGCS2: Ketogenesis Suppression Accelerates NAFLD Progression in T2DM Comorbidity, While Cynaroside Ameliorates NASH in Concomitant T2DM

Yongsheng Shu et al. Biomolecules. .

Abstract

Patients with concurrent non-alcoholic fatty liver disease (NAFLD) and type 2 diabetes mellitus (T2DM) exhibit increased susceptibility to non-alcoholic steatohepatitis (NASH), advanced hepatic fibrosis, cirrhosis, and hepatocellular carcinoma. This study investigated the contribution of ketogenesis to T2DM-mediated NAFLD exacerbation and elucidated the therapeutic mechanism of cynaroside in NASH-complicated T2DM. Male C57BL/6J mice were given CDAHFD combined with streptozotocin to establish stage-specific NAFLD with T2DM models. Hepatic HMGCS2 expression was modulated via tail vein injection of adenoviral vectors for HMGCS2 overexpression or knockdown. Cynaroside was administered orally from week 5 to week 8. The results showed that concurrent T2DM accelerated NAFLD progression, accompanied by a dysregulated ketogenesis that was correlated with disease severity. Hepatic HMGCS2 expression paralleled circulating ketone body concentrations, indicating that HMGCS2-mediated ketogenic dysregulation contributed to NAFLD pathogenesis in T2DM contexts. HMGCS2 overexpression in NASH-T2DM models significantly attenuated steatohepatitis progression through the enhancement of ketogenesis. Cynaroside administration ameliorated hepatic pathology in NASH-T2DM mice by (1) reducing hepatocellular injury and lobular inflammation; (2) decreasing intrahepatic lipid accumulation; and (3) suppressing hepatocyte senescence and the secretion of SASP factors. Mechanistically, cynaroside exerted therapeutic effects via HMGCS2-mediated ketogenesis. Our data demonstrated that ketogenic modulation is a viable therapeutic strategy to delay T2DM-NAFLD progression.

Keywords: cellular senescence; cynaroside; hydroxymethylglutaryl-CoA synthase 2; ketogenesis; non-alcoholic fatty liver disease; type 2 diabetes mellitus.


Conflict of interest statement

The authors declare that they have no conflicts of interest.

Figures

Figure 1
Figure 1
Liver injury and dyslipidemia worsen during the progression from NAFL to NASH in individuals with T2DM. (AD) Serum levels of liver injury markers (ALT, AST) and lipid profiles (TG, TC) were measured (n = 3). Significance: * p < 0.05, ** p < 0.01, *** p < 0.001. (E) Blood glucose meter was used to detect fasting blood glucose in mice (n = 5). Significance: ** p < 0.01, *** p < 0.001 vs. CDAHFD group. (F) Histopathological alterations in hepatocyte lipid accumulation and inflammatory infiltration during the progression from NAFL to NASH in individuals with T2DM (n = 3). Representative H&E-stained liver sections. Scale bar = 100 µm. Inflammation is marked with black arrows. Bar graphs showed the percentage quantification of steatosis and inflammation area using Image J software, as shown in Figure 1F. Significance: * p < 0.05, ** p < 0.01, *** p < 0.001. (G) Progressive changes in hepatocyte lipid accumulation during the transition from NAFL to NASH in T2DM. Representative Oil Red O-stained liver sections (n = 3). Scale bar = 100 µm. Bar graphs showed the percentage quantification of Oil Red O area using Image J software, as shown in Figure 1G. Significance: * p < 0.05, ** p < 0.01, *** p < 0.001. (H,I) The levels of the inflammatory genes IL-1β and TNF-α in the serum of C57BL/6J mice were detected using ELISA kits. Significance: * p < 0.05, ** p < 0.01, *** p < 0.001.
Figure 2
Figure 2
Hepatocyte senescence progressively increased during the transition from NAFL to NASH, with significant exacerbation observed in T2DM-NAFLD cohorts. (A) Representative SA-β-gal-stained liver sections (n = 3). Scale bar = 100 µm. Significance: * p < 0.05, ** p < 0.01. (B) Proteomic analysis was performed to quantify the expression of pro-inflammatory SASP factors in hepatic tissue from control, NASH, and NASH-T2DM comorbidity mice models (n = 3).
Figure 3
Figure 3
Ketone body levels became dysregulated during the progression from NAFL with T2DM to NASH, suggesting a potential association with HMGCS2 regulation. (A,B) Serum concentrations of ketone bodies AcAc and BHB were measured (n = 3). Significance: * p < 0.05, ** p < 0.01, *** p < 0.001. (C,D) Representative western blot analysis and quantification of hepatic HMGCS2 protein expression (n = 3). Significance: * p < 0.05, ** p < 0.01, *** p < 0.001.
Figure 4
Figure 4
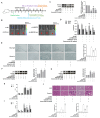
Hepatocyte-specific HMGCS2 overexpression ameliorated NASH with concomitant T2DM in C57BL/6J mice via enhanced ketogenesis. (A) Experimental setup of mice. AAV8 adenovirus delivery: HMGCS2 plasmid and AAV8 adenovirus scramble were administered to CDAHFD + STZ-treated mice. Intraperitoneal injection (i.p.). (B) Bioluminescence imaging using the Caliper IVIS Lumina II system confirmed the predominant hepatic localization of HMGCS2. (C) Western blot analysis confirming HMGCS2 plasmid transfection efficiency in the liver (n = 3). Significance: ** p < 0.01 vs. Empty vector (EV); ## p < 0.01 vs. EV-CDAHFD-STZ (60 mg/kg) group. (D) Serum concentrations of ketone bodies AcAc and BHB were measured (n = 6). Significance: *** p < 0.001 vs. EV; ### p < 0.001 vs. EV-CDAHFD-STZ group. (E,F) Serum levels of hepatic injury markers (ALT, AST) and lipid profiles (TG, TC) were measured (n = 5). Significance: *** p < 0.001 vs. EV; ## p < 0.01, ### p < 0.001 vs. EV-CDAHFD-STZ group. (G) Inflammatory infiltration and lipid accumulation in liver sections were detected using H&E-staining (n = 3). Representative images of H&E-stained liver sections are shown. Scale bar = 100 µm. Inflammation is marked with black arrows. Bar graphs show the percentage quantification of steatosis and inflammation areas using Image J software, as shown in Figure 4G. Significance: *** p < 0.001 vs. EV group; # p < 0.05, ### p < 0.001 vs. EV-CDAHFD-STZ (60 mg/kg) group. (H,I) Quantitative analysis of hepatic senescence markers p53 and p21 protein expression via western blot (n = 3). Significance: ** p < 0.01, *** p < 0.001 vs. EV; # p < 0.05 vs. EV-CDAHFD-STZ group. (J) SA-β-gal staining revealed hepatocyte senescence in liver sections of C57BL/6J mice (n = 3). Representative images shown. Scale bar = 100 µm. Significance: *** p < 0.001 vs. EV group; ### p < 0.001 vs. EV-CDAHFD-STZ (60 mg/kg) group.
Figure 5
Figure 5
Cynaroside ameliorated liver injury and dyslipidemia in NASH with concomitant T2DM mice. (A) Experimental setup of mice. Intragastric administration (i.g.). (B) Determination of the weight of the liver and body, as well as the liver-to-body weight ratio. (C,D) Determination of serum levels of liver injury markers (ALT, AST) and lipid profiles (TG, TC) (n = 5); *** p < 0.001 vs. NC group; # p < 0.05, ## p < 0.01, ### p < 0.001 vs. CDAHFD + STZ (60 mg/kg) group. (E,F) Representative images of H&E and Oil Red O-stained liver sections demonstrating inflammatory infiltration and lipid accumulation (n = 3). Scale bar = 100 µm. Inflammation is marked with black arrows. Bar graphs show the percentage quantification of steatosis, inflammation, and the Oil Red O area using Image J software, as shown in Figure 5E,F. Significance: *** p < 0.001 vs. NC group; ## p < 0.01, ### p < 0.001 vs. CDAHFD + STZ (60 mg/kg) group.
Figure 6
Figure 6
Cynaroside inhibited the cellular senescence of hepatocytes in mice with NASH C57BL/6J complicated by T2DM through the promotion of ketogenesis. (A) Determination of serum levels of ketone body markers (AcAc, BHB) (n = 5). Significance: *** p < 0.001 vs. NC group; # p <0.05, ## p < 0.01, ### p < 0.001 vs. CDAHFD + STZ (60 mg/kg) group. (B) Western blot analyses of HMGCS2 protein levels in liver tissues (n = 3). Significance: *** p < 0.001 vs. NC group; ## p < 0.01, ### p < 0.001 vs. CDAHFD + STZ (60 mg/kg) group. (C) Binding mode of cynaroside in the active site of HMGCS2. The 3D interaction pattern showed an expanded view of residues proximal to cynaroside within the binding site. (D) Representative images of liver sections stained with SA-β-gal staining (n = 3). Scale bar, 100 μm. Significance: *** p < 0.001 vs. NC group; ### p < 0.001 vs. CDAHFD + STZ (60 mg/kg) group. (E,F) Western blot analyses of senescence proteins p53 and p21 protein levels in liver tissues (n = 3); *** p < 0.001 vs. NC group; #p < 0.05, ## p < 0.01, ### p < 0.001 vs. CDAHFD + STZ (60 mg/kg) group. (G) Proteomic analysis was performed to quantify the expression of pro-inflammatory SASP factors in hepatic tissue from NASH + T2DM and NASH + T2DM + cynaroside mice models.
Figure 7
Figure 7
Down-regulation of HMGCS2 attenuated the ameliorative effect of cynaroside on NASH with T2DM by regulating hepatocyte senescence. (A) Experimental setup of mice. Intragastric administration (i.g.). Mice treated with CDAHFD+STZ were intravenously injected via the tail vein with AAV8 vectors delivering HMGCS2 shRNA and scramble shRNA. (B) Bioluminescence imaging using the Caliper IVIS Lumina II system confirmed the predominant hepatic localization of HMGCS2. (C) The transfection efficiency of HMGCS2 shRNA in the liver was evaluated via western blot analysis (n = 3). Significance: *** p < 0.001 vs. sh-NC group; ## p < 0.01 vs. sh-NC + CDAHFD + STZ (60 mg/kg)-treated group; & p < 0.05 vs. sh-NC + CDAHFD + STZ (60 mg/kg) + cynaroside (25 mg/kg)-treated group. (D) Determination of serum levels of ketone body markers (AcAc, BHB) (n = 6). Significance: *** p < 0.001 vs. sh-NC group; # p < 0.05, ## p < 0.01 vs. sh-NC + CDAHFD + STZ (60 mg/kg)-treated group; & p < 0.05, && p < 0.01 vs. sh-NC + CDAHFD + STZ (60 mg/kg) + cynaroside (25 mg/kg)-treated group. (E) SA-β-gal staining revealed hepatocyte senescence in liver sections (n = 3). Representative images shown. Scale bar = 100 µm. Significance: *** p < 0.001 vs. sh-NC group; ### p < 0.001 vs. sh-NC + CDAHFD + STZ (60 mg/kg)-treated group; && p < 0.01 vs. sh-NC + CDAHFD + STZ (60 mg/kg) + cynaroside (25 mg/kg)-treated group. (F,G) Western blot analyses of p53 and p21 levels in liver tissues (n = 3). Significance: *** p < 0.001 vs. sh-NC group; # p < 0.05, ### p < 0.001 vs. sh-NC + CDAHFD + STZ (60 mg/kg)-treated group; & p < 0.05 vs. sh-NC + CDAHFD + STZ (60 mg/kg) + cynaroside (25 mg/kg)-treated group. (H,I) Determination of serum levels of liver injury markers (ALT, AST) and lipid profiles (TG, TC) (n = 5). Significance: *** p <0.001 vs. sh-NC group; ## p < 0.01 vs. sh-NC + CDAHFD + STZ (60 mg/kg) group; & p < 0.05, && p < 0.01 vs. sh-NC + CDAHFD + STZ (60 mg/kg) + cynaroside (25 mg/kg)-treated group. (J) Representative images of liver sections stained with H&E staining (n = 3). Scale bar, 100 μm. Inflammation is marked with black arrows. Bar graphs show the percentage quantification of steatosis, and inflammation area using Image J software, as shown in Figure 7J. Significance: ** p < 0.01, *** p < 0.001 vs. sh-NC group; ### p < 0.001 vs. sh-NC + CDAHFD + STZ (60 mg/kg)-treated group; &&& p < 0.001 vs. sh-NC + CDAHFD + STZ (60 mg/kg) + cynaroside (25 mg/kg)-treated group.

Similar articles

References

    1. Israelsen M., Francque S., Tsochatzis E.A., Krag A. Steatotic liver disease. Lancet. 2024;404:1761–1778. doi: 10.1016/S0140-6736(24)01811-7. - DOI - PubMed
    1. Singal A.K., Shah V.H., Malhi H. Emerging targets for therapy in ALD: Lessons from NASH. Hepatology. 2024;80:223–237. doi: 10.1097/HEP.0000000000000381. - DOI - PMC - PubMed
    1. Younossi Z.M., Golabi P., Paik J.M., Henry A., Van Dongen C., Henry L. The global epidemiology of nonalcoholic fatty liver disease (NAFLD) and nonalcoholic steatohepatitis (NASH): A systematic review. Hepatology. 2023;77:1335–1347. doi: 10.1097/HEP.0000000000000004. - DOI - PMC - PubMed
    1. En Li Cho E., Ang C.Z., Quek J., Fu C.E., Lim L.K.E., Heng Z.E.Q., Tan D.J.H., Lim W.H., Yong J.N., Zeng R., et al. Global prevalence of non-alcoholic fatty liver disease in type 2 diabetes mellitus: An updated systematic review and meta-analysis. Gut. 2023;72:2138–2148. doi: 10.1136/gutjnl-2023-330110. - DOI - PubMed
    1. Dougherty J.A., Guirguis E., Thornby K.A. A Systematic Review of Newer Antidiabetic Agents in the Treatment of Nonalcoholic Fatty Liver Disease. Ann. Pharmacother. 2021;55:65–79. doi: 10.1177/1060028020935105. - DOI - PubMed

MeSH terms

LinkOut - more resources