. 2025 Aug 7;14(8):969.
doi: 10.3390/antiox14080969.

Melatonin During Pre-Maturation and Its Effects on Bovine Oocyte Competence

Affiliations

Melatonin During Pre-Maturation and Its Effects on Bovine Oocyte Competence

Laryssa Ketelyn Lima Pimenta et al. Antioxidants (Basel). .

Abstract

To minimize the deleterious effects of oxidative stress and improve oocyte competence, we assessed the impact of melatonin during in vitro pre-maturation (pre-IVM) in bovine cumulus-oocyte complexes (COCs). We compared three groups: control (conventional IVM), pre-IVM control (without melatonin), and pre-IVM + MTn (with melatonin). The analyses included levels of reactive oxygen species (ROS), mitochondrial activity, oocyte lipid content, and the expression of genes related to oxidative stress and lipid metabolism in oocytes and cumulus cells. We also examined embryo quality by evaluating kinetics of development and gene expression. The pre-IVM + MTn group exhibited an increase (p ≤ 0.05) in ROS levels and a decrease (p ≤ 0.05) in lipid content, while maintaining mitochondrial activity similar (p > 0.05) to that of the control group. Regarding gene expression, the effect of pre-IVM, independent of melatonin, was characterized by a decrease in FABP3 transcripts in cumulus cells and reductions in GSS and NFE2L2 transcripts in oocytes (p ≤ 0.05). The pre-IVM + MTn group also displayed a decrease (p ≤ 0.05) in CAT and SOD2 transcript levels. In terms of embryonic development, the pre-IVM + MTn group achieved a higher blastocyst rate on D7 (p ≤ 0.05) compared to the control group (30.8% versus 25.8%), but with similar rates (p > 0.05) to the pre-IVM control group (30.8% versus 35.9%). However, there was a decrease in the levels of the PLAC8 transcript. This study indicates that, under the conditions tested, melatonin did not significantly benefit oocyte competence.

Keywords: antioxidant; biotechniques; biotechnology; meiosis; qPCR.


Conflict of interest statement

The authors declare no conflicts of interest.

Figures

Figure 1
Figure 1
Representative images of bovine oocytes stained with H2DCFDA (A): Intracellular levels of reactive oxygen species in oocytes in different treatments at different time points. Immature control, 0 h ((a): IC; n = 25); pre-matured for 6 h ((b): PMIC; n = 26); pre-matured in the presence of melatonin for 6 h ((c): PMMI; n = 27); matured control, 24 h ((d): MC; n = 27); pre-matured for 6 h and matured for 24 h ((e): PMMC; n = 23); and pre-matured in the presence of melatonin for 6 h and matured for 24 h ((f): PMMM; n = 16). (B): immature groups; (C): matured groups; (D) before and after in vitro maturation. a,b Different superscripts or * between groups indicate significant differences (p ≤ 0.05).
Figure 2
Figure 2
Representative images of oocytes stained with MitoTracker Deep Red (A). Level of mitochondrial fluorescence intensity in oocytes stained with MitoTracker Deep Red in the different groups. Immature control, 0 h ((a): IC; n = 32); pre-matured for 6 h ((b): PMIC; n = 31); pre-matured in the presence of melatonin for 6 h ((c): PMMI; n = 23); matured control, 24 h ((d): MC; n = 20); pre-matured for 6 h and matured for 24 h ((e): PMMC; n = 17); and pre-matured in the presence of melatonin for 6 h and matured for 24 h ((f): PMMM; n = 20); (B): immature groups; (C): matured groups; (D) before and after in vitro maturation. a,b Different superscripts or * between groups indicate significant differences (p ≤ 0.05).
Figure 3
Figure 3
Representative images of oocytes stained with Bodipy 493/503 (A). Immature control, 0 h ((a): IC; n = 32); pre-matured for 6 h ((b): PMIC; n = 31); pre-matured in the presence of melatonin for 6 h ((c): PMMI; n = 23); matured control, 24 h ((d): MC; n = 20); pre-matured for 6 h and matured for 24 h ((e): PMMC; n = 17); and pre-matured in the presence of melatonin for 6 h and matured for 24 h ((f): PMMM; n = 20); Area of lipid droplets relative to the total area of the oocytes to evaluate the lipid droplets in the different groups. (B): immature groups; (C): matured groups; (D) before and after in vitro maturation. a,b Different superscripts or * between groups indicate significant differences (p ≤ 0.05).
Figure 4
Figure 4
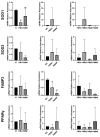
Relative mRNA levels of genes related to antioxidant defense (SOD1 and SOD2) and lipid metabolism (FABP3 and PPARγ) in cumulus cells of the cumulus–oocyte complex from different treatments and time points: immature control, 0 h (IC); pre-matured for 6 h (PMIC); pre-matured in the presence of melatonin for 6 h (PMMI); matured control, 24 h (MC); pre-matured for 6 h and matured for 24 h (PMMC); and pre-matured in the presence of melatonin for 6 h and matured for 24 h (PMMM). a,b Different superscripts indicate significant differences between groups (p ≤ 0.05).
Figure 5
Figure 5
Relative mRNA levels of genes related to antioxidant defense (CAT, SOD1, SOD2, GSS, and NFE2L2) in oocytes in different treatments at different time points: immature control, 0 h (IC); pre-matured for 6 h (PMIC); pre-matured in the presence of melatonin for 6 h (PMMI); matured control, 24 h (MC); pre-matured for 6 h and matured for 24 h (PMMC); and pre-matured in the presence of melatonin for 6 h and matured for 24 h (PMMM). a,b Different superscripts or * between groups indicate significant differences (p ≤ 0.05).
Figure 6
Figure 6
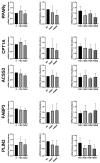
Relative mRNA levels of genes associated with lipid metabolism (PPARγ, CPT1A, ACSS2, FABP3, and PLIN2) in oocytes in different treatments at different time points: immature control, 0 h (IC); pre-matured for 6 h (PMIC); pre-matured in the presence of melatonin for 6 h (PMMI); matured control, 24 h (MC); pre-matured for 6 h and matured for 24 h (PMMC); and pre-matured in the presence of melatonin for 6 h and matured for 24 h (PMMM).
Figure 7
Figure 7
Relative mRNA levels of genes related to embryo quality (PLAC8, KRT8, PRDX6, and SLC2A3) in expanded blastocysts from three groups: control (in vitro maturation, 24 h); pre-IVM control (pre-IVM for 6 h and MIV for 24 h); and pre-IVM + MTn (pre-IVM in the presence of melatonin for 6 h, and MIV for 24 h). a,b Different superscripts indicate significant differences between groups (p ≤ 0.05).

References

    1. Caixeta E.S., Ripamonte P., Franco M.M., Junior J.B., Dode M.A.N. Effect of follicle size on mRNA expression in cumulus cells and oocytes of Bos indicus: An approach to identify marker genes for developmental competence. Reprod. Fertil. Dev. 2009;21:655–664. doi: 10.1071/RD08201. - DOI - PubMed
    1. Strączyńska P., Papis K., Morawiec E., Czerwiński M., Gajewski Z., Olejek A., Bednarska-Czerwińska A. Signaling mechanisms and their regulation during in vivo or in vitro maturation of mammalian oocytes. Reprod. Biol. Endocrinol. 2022;20:37. doi: 10.1186/s12958-022-00906-5. - DOI - PMC - PubMed
    1. Roelen B.A.J. Bovine oocyte maturation: Acquisition of developmental competence. Reprod. Fertil. Dev. 2019;32:98–103. doi: 10.1071/RD19255. - DOI - PubMed
    1. Jiang Y., He Y., Pan X., Wang P., Yuan X., Ma B. Advances in Oocyte Maturation In Vivo and In Vitro in Mammals. Int. J. Mol. Sci. 2023;24:9059. doi: 10.3390/ijms24109059. - DOI - PMC - PubMed
    1. Takahashi M. Oxidative Stress and Redox Regulation on In Vitro Development of Mammalian Embryos. J. Reprod. Dev. 2012;58:1–9. doi: 10.1262/jrd.11-138N. - DOI - PubMed

LinkOut - more resources