. 2025 Jul 22;13(8):1789.
doi: 10.3390/biomedicines13081789.

Transcriptomic Profile of Perineural Invasion in Prostate Cancer Identifies Prognostic Gene Signatures

Affiliations

Transcriptomic Profile of Perineural Invasion in Prostate Cancer Identifies Prognostic Gene Signatures

Cagdas Aktan et al. Biomedicines. .

Abstract

Background: Prostate cancer is a common malignancy among men worldwide, with various histopathologic features that influence its progression and prognosis. One such feature is perineural invasion (PNI), which has been associated with aggressive disease. In this retrospective study, we analyzed genomic alterations associated with PNI in patients who underwent radical prostatectomy. Methods: A total of 421 prostate cancer patients who underwent radical prostatectomy without neoadjuvant therapy were identified from The Cancer Genome Atlas. PNI was present in 378 patients (89.8%) and absent in 43 (10.2%). Differentially expressed genes were identified, and mRNA expression levels of key genes were analyzed. The prognostic significance of these genes was evaluated using log-rank tests and Cox proportional hazards models to estimate hazard ratios and 95% confidence intervals. Results: Levels of COL9A3, ASPN, ESR1, MUC1, PIP, SFRP4, KRT19, CLDN1, and COMP were significantly higher in the tumor tissues of patients in the PNI group compared to those in the non-PNI group (q < 0.05), and RYR2, MME, and AZGP1 expression levels were significantly higher in the non-PNI group (q < 0.05). A high mRNA expression level of AZGP1 was associated with longer disease-free survival, whereas high mRNA expressions of ASPN, COMP, RYR2, and SFRP4 were associated with shorter disease-free survival. Conclusions: Prostate cancer patients with genomic alterations associated with PNI may face a higher risk of disease progression after prostatectomy, highlighting the need for further prospective studies to validate these findings.

Keywords: perineural invasion; prognostic biomarkers; prostate cancer.


Conflict of interest statement

The authors declare no conflicts of interest.

Figures
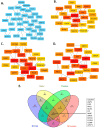
Figure 1
Figure 1
Protein–protein interaction (PPI) network analysis of differentially expressed genes (DEGs) between PNI and non-PNI prostate cancer groups. Each node represents a protein encoded by a DEG, and each edge (lines connecting the nodes) represents a predicted protein–protein interaction. (A) The most significant module within the PPI network, identified using the MCODE Cytoscape (v3.10.3). Top-ranked hub genes identified using CytoHubba ranking algorithms: degree (B), closeness (C), and betweenness (D). (E) Venn diagram showing the intersection of hub genes identified by MCODE and all three CytoHubba algorithms, yielding 12 overlapping hub genes.
Figure 2
Figure 2
The mRNA expression level of the hub genes. Abbreviations: PNI, perineural invasion. Figure 2 was generated using log2-transformed RSEM expression values from cBioPortal v6.2. Fold-change and statistical comparisons are based on the platform’s calculations using Student’s t-test and FDR correction (Benjamini–Hochberg). The plot is intended to illustrate the expression distribution between groups rather than to visually represent raw fold-change magnitude.
Figure 3
Figure 3
Genetic alterations of genes with the most significant p-values (A) and the hub genes (B). Significance of p < 0.05 is marked with a *. Abbreviations: PNI, perineural invasion.
Figure 4
Figure 4
Kaplan–Meier analysis of disease-free survival (A) and overall survival (B) based on mRNA expression levels of hub genes. Patients were stratified into high- and low-expression cohorts. Red and blue curves represent the high- and low-expression groups, respectively. Solid lines indicate survival estimates; dotted lines represent 95% confidence intervals. The p-value reflects the statistical significance of the difference in survival curves between the two groups, as determined by the log-rank test. The hazard ratio (HR) represents the relative risk of an event occurring in the high-expression group compared to the low-expression group, and p(HR) indicates the statistical significance of this estimate based on the Cox proportional hazards model. A p-value < 0.05 was considered statistically significant for both tests.
Figure 4
Figure 4
Kaplan–Meier analysis of disease-free survival (A) and overall survival (B) based on mRNA expression levels of hub genes. Patients were stratified into high- and low-expression cohorts. Red and blue curves represent the high- and low-expression groups, respectively. Solid lines indicate survival estimates; dotted lines represent 95% confidence intervals. The p-value reflects the statistical significance of the difference in survival curves between the two groups, as determined by the log-rank test. The hazard ratio (HR) represents the relative risk of an event occurring in the high-expression group compared to the low-expression group, and p(HR) indicates the statistical significance of this estimate based on the Cox proportional hazards model. A p-value < 0.05 was considered statistically significant for both tests.
Figure 5
Figure 5
Kaplan–Meier analysis of overall survival (A) and disease-free survival (B) based on mRNA expression levels of genes with frequent genetic alterations. Patients were stratified into high- and low-expression cohorts. Red and blue curves represent the high- and low-expression groups, respectively. Solid lines indicate survival estimates; dotted lines represent 95% confidence intervals. The p-value reflects the statistical significance of the difference in survival curves between the groups, as assessed by the log-rank test. The hazard ratio (HR) represents the relative risk of an event occurring in the high-expression group, and p(HR) indicates the significance of this estimate from the Cox proportional hazards model. A p-value < 0.05 was considered statistically significant for both tests.
Figure 5
Figure 5
Kaplan–Meier analysis of overall survival (A) and disease-free survival (B) based on mRNA expression levels of genes with frequent genetic alterations. Patients were stratified into high- and low-expression cohorts. Red and blue curves represent the high- and low-expression groups, respectively. Solid lines indicate survival estimates; dotted lines represent 95% confidence intervals. The p-value reflects the statistical significance of the difference in survival curves between the groups, as assessed by the log-rank test. The hazard ratio (HR) represents the relative risk of an event occurring in the high-expression group, and p(HR) indicates the significance of this estimate from the Cox proportional hazards model. A p-value < 0.05 was considered statistically significant for both tests.

References

    1. Shoag J., Barbieri C.E. Clinical variability and molecular heterogeneity in prostate cancer. Asian J. Androl. 2016;18:543–548. doi: 10.4103/1008-682x.178852. - DOI - PMC - PubMed
    1. Lin D., Ettinger S.L., Qu S., Xue H., Nabavi N., Choi S.Y.C., Bell R.H., Mo F., Haegert A.M., Gout P.W., et al. Metabolic heterogeneity signature of primary treatment-naïve prostate cancer. Oncotarget. 2017;8:25928–25941. doi: 10.18632/oncotarget.15237. - DOI - PMC - PubMed
    1. Brönimann S., Pradere B., Karakiewicz P., Abufaraj M., Briganti A., Shariat S.F. An overview of current and emerging diagnostic, staging and prognostic markers for prostate cancer. Expert. Rev. Mol. Diagn. 2020;20:841–850. doi: 10.1080/14737159.2020.1785288. - DOI - PubMed
    1. Mizuno K., Beltran H. Future directions for precision oncology in prostate cancer. Prostate. 2022;82((Suppl. S1)):S86–S96. doi: 10.1002/pros.24354. - DOI - PMC - PubMed
    1. Cozzi G., Rocco B.M., Grasso A., Rosso M., Abed El Rahman D., Oliva I., Talso M., Costa B., Tafa A., Palumbo C., et al. Perineural invasion as a predictor of extraprostatic extension of prostate cancer: A systematic review and meta-analysis. Scand. J. Urol. 2013;47:443–448. doi: 10.3109/21681805.2013.776106. - DOI - PubMed

LinkOut - more resources