. 2025 Aug 14;13(8):1973.
doi: 10.3390/biomedicines13081973.

Clustering Cortical Rhythms: Monoaminergic Signatures in Time-Frequency EEG Dynamics

Affiliations

Clustering Cortical Rhythms: Monoaminergic Signatures in Time-Frequency EEG Dynamics

Vasily Vorobyov et al. Biomedicines. .

Abstract

Background: Multiple studies of the role of neurotransmitter systems in the effects of various substances on brain functions under normal conditions and at various brain disorders have demonstrated the relatively high usefulness of the electroencephalogram (EEG). However, little is known about EEG "fingerprints" of direct neurotransmitter-receptor interactions, in particular, for monoamine (MA) systems involved in the main brain functions. Methods: We looked at how the EEG effects of serotonin, dopamine, and norepinephrine receptors activating substances (quipazine, SKF-38393, and clonidine, respectively) injected into the brain's lateral ventricles were affected by corresponding blockers (cyproheptadine, SCH-23390, and yohimbine) in freely moving rats. We introduced a method for clustering significant changes in the EEG spectra based on specific time intervals and narrow frequency subranges. Results: Stimulating serotonin and dopamine receptors caused specific suppression of EEG activity around 10 Hz and an increase near 18 Hz, respectively. The effects were reduced after pretreatment with the corresponding receptor blockers. Clonidine produced clusters of increased and decreased EEG activity around 6 Hz and 21 Hz, respectively, which were weakened by the blocker, yohimbine. These results demonstrate the "signatures" of different MA systems in EEG time-frequency clustering. Conclusions: We consider the developed approach as a potentially useful tool in clinics for evaluation of MA transmission pathology and its therapy with corresponding substances penetrating the blood-brain barrier.

Keywords: EEG; SCH-23390; SKF-38393; agonist; antagonist; clonidine; clustering; cyproheptadine; electroencephalogram; frequency; quipazine; yohimbine.


Conflict of interest statement

The authors declare no conflicts of interest.

Figures

Figure 1
Figure 1
Averaged frequency spectra of EEG from the frontal cortex in 10-min baseline intervals in rats (n = 5). Ordinate is an averaged EEG amplitude in individual frequency sub-range normalized to the sum of the amplitudes in the whole spectrum, in arbitrary units (AU); abscissa indicates different frequency subranges denoted by their central frequencies, in hertz (Hz); vertical bars are ±SEM.
Figure 2
Figure 2
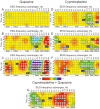
EEG effects of i.c.v. injected quipazine (vs. saline) at doses of 1, 10, and 100 nmol (AC) (n = 6) and cyproheptadine at doses of 10, 100, and 1000 nmol (DF) (n = 6). On plate G, relative changes in the effects of quipazine at a dose of 100 nmol produced by i.c.v. pretreatment with cyproheptadine at a dose of 10 nmol vs. those with saline pretreatment (n = 6). Cyproheptadine inverted both the (–) and (+) clusters with central frequencies of 1 and 10 Hz (G) characteristic for quipazine (C). (The main statistical data are presented in Table A1).
Figure 3
Figure 3
EEG effects of i.c.v. injected SKF-38393 (vs. saline) at doses of 10, 50, and 100 nmol (AC) (n = 8) and SCH-23390 at doses of 10 and 100 nmol (D,E) (n = 8). On plate F, relative changes in the effects of SKF-38393 at a dose of 100 nmol produced by i.c.v. pretreatment with SCH-23390 at a dose of 10 nmol vs. those with saline pretreatment (n = 8). SCH-23390 significantly suppressed the (+) cluster with a central frequency of 18 Hz (F), characteristic of SKF-38393 (C). (The main statistical data are presented in Table A2).
Figure 4
Figure 4
EEG effects of i.c.v. injected clonidine (vs. saline) at doses of 1, 10, and 100 nmol (AC) (n = 8) and yohimbine at a dose of 10 nmol (D) (n = 8). On plate E, relative changes in the effects of clonidine at the dose of 100 nmol produced by i.c.v. pretreatment with yohimbine at a dose of 10 nmol vs. those with saline pretreatment (n = 8). Yohimbine amplified the (+) cluster around 6 Hz and diminished the (−) cluster in the vicinity of 21 Hz (E), which were induced by clonidine (C). (The main statistical data are presented in Table A3.)

References

    1. Itil T.M. The significance of quantitative pharmaco-EEG in the discovery and classification of psychotropic drugs. In: Herrmann W.M., editor. EEG in Drug Research. Gustav Fischer; Stuttgart, Germany: 1982. pp. 131–157.
    1. Eccles C. EEG correlates of neurotoxicity. Neurotoxicology Teratol. 1988;10:423–428. doi: 10.1016/0892-0362(88)90003-7. - DOI - PubMed
    1. Feshchenko V.A., Veselis R.A., Reinsel R.A. Comparison of the EEG effects of midazolam, thiopental, and propofol—The role of underlying oscillatory systems. Neuropsychobiology. 1997;35:211–220. doi: 10.1159/000119347. - DOI - PubMed
    1. Kurimoto E., Nakashima M., Kimura H., Suzuki M. TAK-071, a muscarinic M1 receptor positive allosteric modulator, attenuates scopolamine-induced quantitative electroencephalogram power spectral changes in cynomolgus monkeys. PLoS ONE. 2019;14:e0207969. doi: 10.1371/journal.pone.0207969. - DOI - PMC - PubMed
    1. Masychev K., Ciprian C., Ravan M., Manimaran A., Deshmukh A. Quantitative biomarkers to predict response to clozapine treatment using resting EEG data. Schizophr. Res. 2020;223:289–296. doi: 10.1016/j.schres.2020.08.017. - DOI - PubMed

LinkOut - more resources