. 2025 Aug 10;26(16):7721.
doi: 10.3390/ijms26167721.

Repurposing the Antibiotic D-Cycloserine for the Treatment of Hyperpigmentation: Therapeutic Potential and Mechanistic Insights

Affiliations

Repurposing the Antibiotic D-Cycloserine for the Treatment of Hyperpigmentation: Therapeutic Potential and Mechanistic Insights

Ye-Jin Lee et al. Int J Mol Sci. .

Abstract

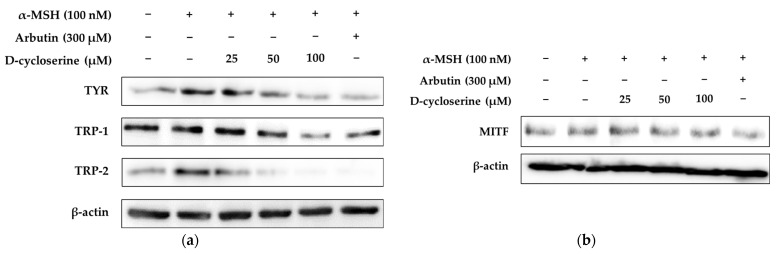
Melanin overproduction contributes to hyperpigmentation disorders such as melasma and solar lentigines, leading to increasing demand for safe and effective skin-lightening agents. D-cycloserine (DCS), a known antimicrobial agent, has not been previously evaluated for dermatological applications. This study aimed to explore the potential of DCS as a novel anti-melanogenic compound and to elucidate its underlying molecular mechanisms in melanogenesis inhibition. The cytotoxicity and anti-melanogenic effects of DCS were assessed in B16F10 melanoma cells stimulated with α-MSH. Cell viability was determined via MTT assays, while melanin content, tyrosinase activity, and the expression levels of MITF, TYR, TRP-1, TRP-2, and major signaling proteins (e.g., CREB, MAPKs, GSK-3β/β-catenin) were evaluated using colorimetric assays and Western blotting. A 3D human skin model was also used to confirm in vitro findings, and a primary skin irritation test was conducted to assess dermal safety. DCS significantly reduced α-MSH-induced melanin content and tyrosinase activity without cytotoxicity at concentrations ≤100 µM. It downregulated MITF and melanogenic enzyme expression and modulated signaling pathways by enhancing ERK activation while inhibiting CREB, JNK, and p38 phosphorylation. Additionally, DCS suppressed β-catenin stabilization via GSK-3β activation. These effects were confirmed in a 3D human skin model, and a clinical skin irritation study revealed no adverse reactions in human volunteers. DCS exerts its anti-melanogenic effect by targeting multiple pathways, including CREB/MITF, MAPK, and GSK-3β/β-catenin signaling. Its efficacy and safety profiles support its potential as a novel cosmeceutical agent for the treatment of hyperpigmentation. Further clinical studies are warranted to confirm its therapeutic utility in human skin pigmentation disorders.

Keywords: B16F10; CREB; D-cycloserine; MAPK pathway; PI3K/Akt pathway; cosmeceutical; drug repurposing; hyperpigmentation; melanogenesis; β-catenin.


Conflict of interest statement

The authors declare no conflicts of interest.

Figures

Figure 1
Figure 1
Effects of DCS on cell viability, melanin synthesis, and tyrosinase activity in B16F10 melanoma cells. (a) Chemical structure of DCS. (b) Cytotoxicity of DCS at concentrations ranging from 25 to 800 µM was assessed using the MTT assay after 72 h exposure. DCS showed dose-dependent cytotoxicity at concentrations ≥ 100 µM. (c) Melanin content was quantified in B16F10 cells stimulated with α-MSH (100 nM) and treated with DCS (25, 50, 100 µM) or arbutin (300 µM) for 72 h. DCS significantly reduced melanin content in a dose-dependent manner, comparable to arbutin. (d) Intracellular tyrosinase activity was measured under the same conditions as (c). DCS suppressed tyrosinase activity in a concentration-dependent fashion. Data are expressed as mean ± SD of three independent experiments. Statistical significance is denoted as # p < 0.001 compared to the untreated control group; * p < 0.05 and ** p < 0.01; and *** p < 0.001 compared to the α-MSH-treated group.
Figure 2
Figure 2
Effects of DCS on melanogenic protein and MITF expression in α-MSH-stimulated B16F10 cells. (a,b) Representative Western blot images showing the expression levels of TYR, TRP-1, TRP-2, and MITF in B16F10 cells treated with α-MSH (100 nM), DCS (25, 50, or 100 µM), or arbutin (300 µM) for 48 h. β-actin was used as the internal loading control. (bd) Quantitative densitometric analysis of TYR (c), TRP-1 (d), TRP-2 (e), and MITF (f) protein levels relative to β-actin, expressed as percentage of the untreated control. α-MSH stimulation significantly upregulated the expression of melanogenic proteins, whereas treatment with DCS reduced their expression in a dose-dependent manner, similar to the effect of arbutin. Protein band intensities were quantified using ImageJ software (version 9.4.0), normalized to β-actin, and expressed as the mean ± SD from at least three independent experiments. Statistical significance is denoted as # p < 0.001 compared to the untreated control group and *** p < 0.001 compared to the α-MSH-treated group.
Figure 2
Figure 2
Effects of DCS on melanogenic protein and MITF expression in α-MSH-stimulated B16F10 cells. (a,b) Representative Western blot images showing the expression levels of TYR, TRP-1, TRP-2, and MITF in B16F10 cells treated with α-MSH (100 nM), DCS (25, 50, or 100 µM), or arbutin (300 µM) for 48 h. β-actin was used as the internal loading control. (bd) Quantitative densitometric analysis of TYR (c), TRP-1 (d), TRP-2 (e), and MITF (f) protein levels relative to β-actin, expressed as percentage of the untreated control. α-MSH stimulation significantly upregulated the expression of melanogenic proteins, whereas treatment with DCS reduced their expression in a dose-dependent manner, similar to the effect of arbutin. Protein band intensities were quantified using ImageJ software (version 9.4.0), normalized to β-actin, and expressed as the mean ± SD from at least three independent experiments. Statistical significance is denoted as # p < 0.001 compared to the untreated control group and *** p < 0.001 compared to the α-MSH-treated group.
Figure 3
Figure 3
Effects of DCS on the GSK-3β/β-catenin signaling pathway in α-MSH-stimulated B16F10 cells. (a) Representative Western blot images showing the expression of total β-catenin, total and phosphorylated GSK-3β (p-GSK-3β), and phosphorylated β-catenin (p-β-catenin) following treatment with α-MSH (100 nM), DCS (25, 50, or 100 µM), or arbutin (300 µM). β-actin was used as the internal loading control. (bd) Results of densitometric analysis of total β-catenin (b), p-GSK-3β (c), and p-β-catenin (d) expression levels, normalized to β-actin and expressed as percentage of the untreated control. Treatment with α-MSH increased β-catenin and p-GSK-3β levels while reducing p-β-catenin, consistent with the activation of melanogenesis. DCS reversed these effects in a dose-dependent manner, indicating that it promotes β-catenin degradation and suppresses melanogenic signaling through GSK-3β activation. Protein band intensities were quantified using ImageJ software and normalized to β-actin and are expressed as the mean ± SD from at least three independent experiments. Statistical significance is indicated as # p < 0.001 compared to the untreated control group and *** p < 0.001 compared to the α-MSH-treated group.
Figure 4
Figure 4
Effect of DCS on AKT signaling pathway protein expression in α-MSH-stimulated B16F10 cells. (a) Representative Western blot images showing the protein levels of phosphorylated AKT (p-AKT) and total AKT following treatment with α-MSH (100 nM), DCS (25, 50, or 100 µM), or arbutin (300 µM). β-actin was used as the internal control. (b) Results of densitometric analysis of p-AKT/AKT protein expression ratio, normalized to β-actin and expressed as a percentage of the untreated control. α-MSH stimulation significantly increased AKT phosphorylation, while DCS dose-dependently reduced p-AKT levels, suggesting that DCS suppresses the melanogenic PI3K/AKT pathway. Data represent the mean ± SD from at least three independent experiments. ** p < 0.01, *** p < 0.001 vs. α-MSH-only group; # p < 0.001 vs. untreated control.
Figure 5
Figure 5
Effects of DCS on MAPK signaling pathways in α-MSH-stimulated B16F10 melanoma cells. (a) Representative Western blot images showing the phosphorylation and total protein levels of ERK, p38, and JNK following treatment with α-MSH (100 nM), DCS (25, 50, or 100 µM), or arbutin (300 µM). β-actin was used as the loading control. (bd) Results of densitometric analyses of phosphorylated ERK (b), p38 (c), and JNK (d) protein levels, normalized to their respective total proteins and β-actin, and expressed as percentages of the control. α-MSH stimulation markedly increased the phosphorylation of all three MAPKs. DCS treatment significantly downregulated the phosphorylation of p38 and JNK in a dose-dependent manner and partially attenuated ERK activation. Statistical significance is indicated as # p < 0.001 compared to the untreated control group and *** p < 0.001 compared to the α-MSH-treated group.
Figure 6
Figure 6
Effects of DCS on CREB phosphorylation in α-MSH-stimulated B16F10 melanoma cells. (a) Representative Western blot images showing levels of phosphorylated CREB (p-CREB) and total CREB after treatment with α-MSH (100 nM), DCS (25, 50, or 100 µM), or arbutin (300 µM). β-actin was used as a loading control. (b) Results of densitometric analysis of p-CREB protein levels, normalized to total CREB and β-actin, and expressed as percentages relative to the control group. α-MSH markedly enhanced p-CREB expression, while DCS treatment significantly and dose-dependently suppressed CREB phosphorylation. Statistical significance is indicated as # p < 0.001 compared to the untreated control group and *** p < 0.001 compared to the α-MSH-treated group.
Figure 7
Figure 7
Schematic diagram of melanogenesis-related pathways modulated by DCS. The figure illustrates key signaling pathways involved in melanogenesis, including Wnt/β-catenin, PI3K/AKT, cAMP/CREB, and MAPK (p38, JNK, ERK), all converging on MITF regulation. DCS is proposed to inhibit melanogenesis by (1) reducing MITF degradation via MAPK inhibition, (2) stabilizing β-catenin through GSK3β suppression, and (3) downregulating MITF expression via inhibiting CREB phosphorylation.

Similar articles

References

    1. Akl J., Lee S., Ju H.J., Parisi R., Kim J.Y., Jeon J.J., Heo Y.W., Eleftheriadou V., Hamzavi I., Griffiths C.E.M., et al. Global Vitiligo Atlas. Estimating the burden of vitiligo: A systematic review and modelling study. Lancet Public Health. 2024;9:e386–e396. doi: 10.1016/S2468-2667(24)00026-4. - DOI - PubMed
    1. Ismail I.B., Bhat Y.J., Ul Islam M.S. Treatment Advances in Vitiligo: An Updated Review. Dermatol. Pract. Concept. 2025;15:4600. doi: 10.5826/dpc.1501a4600. - DOI - PMC - PubMed
    1. Dabas G., Vinay K., Parsad D., Kumar A., Kumaran M.S. Psychological disturbances in patients with pigmentary disorders: A cross-sectional study. J. Eur. Acad. Dermatol. Venereol. 2020;34:392–399. doi: 10.1111/jdv.15987. - DOI - PubMed
    1. Pinzi L., Bisi N., Rastelli G. How drug repurposing can advance drug discovery: Challenges and opportunities. Front. Drug Discov. 2024;4:1460100. doi: 10.3389/fddsv.2024.1460100. - DOI
    1. Beninger P. Thalidomide: Following Tragedy, a Repurposed Molecule With Continuing Opportunities for Clinical Benefit. Clin. Ther. 2025;47:249–251. doi: 10.1016/j.clinthera.2025.01.011. - DOI - PubMed

MeSH terms