. 2025 Aug 12;26(16):7783.
doi: 10.3390/ijms26167783.

CO and NO Coordinate Developmental Neuron Migration

Affiliations

CO and NO Coordinate Developmental Neuron Migration

Sabine Knipp et al. Int J Mol Sci. .

Abstract

Similarly to the short-lived messenger nitric oxide (NO), the more stable carbon monoxide (CO) molecule can also activate soluble guanylyl cyclase (sGC) to increase cGMP levels. However, CO-induced cGMP production is much less efficient. Using an accessible invertebrate model, we dissect a potential interaction between the canonical NO/sGC/cGMP and CO signalling pathways during development. The embryonic midgut of locusts is innervated by neurons that migrate in four discrete chains on its outer surface. Transcellular diffusing NO stimulates enteric neuron migration via cGMP signalling. The application of an NO donor results in virtually all enteric neurons being cGMP-immunoreactive while CO increases cGMP production only in approximately 33% of the migrating neurons. Cellular CO release appears to act as a slow down signal for motility. We quantify how CO specifically increases the interneuronal distance during chain migration. Moreover, time-lapse microscopy shows that CO reduces the directionality of the migrating neurons. These findings support the function of NO and CO as antagonistic signals for the coordination of collective cell migration during the development of the enteric nervous system. These experiments and the resulting insights into basic scientific questions prove once more that locust embryos are not only preparations for basic research, but also relevant models for screening of drugs targeting NO and CO signalling pathways as well as for isolating compounds affecting neuronal motility in general.

Keywords: chain migration; directionality; enteric nervous system; gaseous messenger signalling; locust embryo; neural development.


Conflict of interest statement

The authors declare no conflicts of interest. The funders had no role in the design of the study; in the collection, analyses, or interpretation of data; in the writing of the manuscript; or in the decision to publish the results.

Figures

Figure 1
Figure 1
Carbon monoxide and nitric oxide/cGMP signalling cascades modulate cell migration. Schematic diagram illustrating the main steps of intra- and intercellular signalling and experimental manipulation of the pathways. Ca2+–Calmodulin (CaM)-activated nitric oxide synthase (NOS) releases nitric oxide (NO) during the conversion of L-arginine to L-citrulline. Diffusible NO binds to soluble guanylyl cyclase (sGC) in neighbouring cells and stimulates synthesis of cGMP from GTP. cGMP activates downstream signalling cascades to the cytoskeleton which result in enhanced cell migration. In parallel, intracellular heme oxygenase enzymes (HO), such as the constitutive isoform HO-2, release carbon monoxide (CO) as a byproduct during heme degradation to biliverdin. CO can bind to sGC and stimulate cGMP production, though with a rather modest increase in cGMP level compared to NO activation (indicated by blunt tip). Either NOS and HO activity can be imitated by application of NO and CO donors to the culture medium. Additionally, application of the sGC sensitiser YC-1 can increase cGMP production upon NO or CO binding. cGMP can be further enriched by inhibition of cGMP-degrading phosphodiesterases (PDE) via 3-isobutyl-1-methylxanthin (IBMX). (Diagram adapted from [12].)
Figure 2
Figure 2
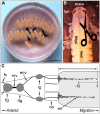
Graphical summary of the experimental setup to study enteric neuron migration in vivo. (A) Locusta embryos of the same clutch and developmental stage are immobilised in a Sylgard-embedded 35 mm Petri dish with L15 culture medium. (B) A small incision in the dorsal epidermis above the foregut allows access of culture medium and added pharmacological agents to the developing ENS. After 24 h of incubation, guts are dissected (visible here through the opaque epidermis as yellow, yolk-filled tube), enteric neurons are immunocytochemically labelled, and migratory tracks are analysed. Scale bars indicate 10 mm in (A) and 1 mm in (B). (C) Schematic drawing of the locust embryonic foregut and anterior midgut at 65% E in dorsal view (adapted from [12]) with midgut shaded in light grey and ganglia and neurons in dark grey. For quantification of the maximum enteric neuron migration, the distance from the foregut–midgut boundary to the leading enteric neuron was measured, as indicated by double headed arrow. Additionally, dispersion of enteric neurons along the migratory chain was calculated by measuring spreading of the leading ten neurons (indicated by scale below migratory pathway). ca, cecum; en, enteric neuron; env, oesophageal nerve; fc, frontal connective; fg, frontal ganglion; hg, hypocerebral ganglion; ig, ingluvial ganglion; rnv, recurrent nerve.
Figure 3
Figure 3
Immunocytochemical analysis of NO- and CO-dependent cGMP signalling in enteric midgut neurons. Fluorescence microscopy images of gut tissue blot preparations (A), whole mount locust embryo midguts (C,D), or confocal images of gut blot preparations (B) at stages between 65 and 75% of development (% E). Heme oxygenase (HO) immunoreactivity (IR) is depicted in red, cGMP-IR in magenta, horse radish peroxidase (B) or alpha-acetylated tubulin counterstaining (C,D) in green. Bottom panels are respective merged images. In merged images, (+) indicates cGMP-IR-positive and (−) cGMP-IR-negative cells, as judged and counted by microscopic observation. Anterior is to the left, cells are migrating to the right as indicated; scale bars represent 50 µm. (A) At 75% E virtually all enteric neurons express HO-2, as is true for the whole midgut migration [12]. (B) While virtually all neurons express high cGMP-IR after pre-incubation with an NO donor, almost no cGMP-IR can be detected after pre-incubation with sGC sensitiser YC1 and phosphodiesterase inhibitor IBMX alone (C). (D) Using a CO donor can elevate cGMP levels in migrating midgut neurons, though only in a third of the cells compared to NO activation. (E) Quantification of cGMP-IR-positive cells after pre-incubation as in (BD). Midgut neurons were counted manually on independently prepared midgut samples. Sample numbers: NO donor = 5, YC1 + IBMX = 17; CO donor = 22. Depicted are mean percentages with SEM relative to total cell numbers derived from enteric neuron labelling. m, midgut musculature; hc, hemocyte.
Figure 4
Figure 4
CO modulates interneuronal distance of migrating enteric neurons. Locust embryos were cultivated for 24 h as in vivo culture in L15 medium supplemented with DMSO (control group), 5 µM ZnBG, or the CO donor CORM-II (20 µM) diluted in DMSO. Data result from four independent experimental repeats, with total sample sizes of n = 40 for control and n = 55 for ZnBG, and three repeats with total sample sizes of n = 36 and n = 38 for CORM-II. Data for maximum migration (A) were previously gathered and originally published in [12]. Here we re-evaluated imaging data for additional analysis (B,C). (A,B) Data summarised in violin box plots with median values indicated by horizontal line; red diamond icons mark respective mean values, as in all following data plots. (A) Maximum migration distance covered by leading enteric neurons is significantly increased through inhibition of CO-releasing heme oxygenase enzymes (p = 0.00113), while application of CO donor reduces migration (p = 0.0198). (B) Leading ten enteric neurons of migratory tracks are significantly farther stretched if CO is decreased (p = 0.00473), but excess CO causes these neurons to accumulate (p = 0.00903). (C) Scatter plot illustrating relationship between maximum enteric neuron migration (A) and spreading of leading ten neurons (B) with respective regression lines for each condition. To allow for summary of all values from different experiment settings in one graph, individual values are given as percentage of respective experimental mean control (=100%). Spearman correlation coefficients are given in top left corner for control group in blue (p = 0.0626), CO donor in green (p = 0.1295), and ZnBG treatment in grey (p = 0.00812). p < 0.05 = *, p < 0.01 = **.
Figure 5
Figure 5
Live-cell-imaging-based analysis of enteric neuron migrational behaviour. Developing locust embryo ENSs were grown as gut tissue blots and microscopically imaged for up to 12 h, with 2-min image intervals. At least 10 individual enteric neurons were tracked and quantified for the first 8 h of the resulting image sequences (n = 95 from four experiments (control), n = 64 from five experiments (ZnBG)). Key variables are summarised as violin box plots. (A) Individual cell velocities were measured between frames and averaged over time. (B) Total track lengths were measured for individual cells. Raw data from (A,B) were normalised using z-scoring for each individual live cell experiment to reduce variations between experiments before summary and statistical analysis. (C) Directionality was calculated as the ratio between the shortest distance between individual cell start and end positions and the total path length accumulated by the same cell. (D,E) Exemplary endpoint images of time-lapse videos for control (D) and HO enzyme inhibition (E) after tracking of individual cells. Full videos can be found as Supplementary Videos S1 (= D) and S2 (= E). Scale bars represent 100 µm; the anterior is to the left, while cells migrate to the right. p < 0.05 = *.
Figure 6
Figure 6
Signalling to the cytoskeleton downstream of cGMP. (A) Inhibition of Rho kinase with Y27632 significantly increases migration on the locust embryo midgut (p = 0.032). Maximum midgut migratory track lengths after 24 h in vivo culture with/without inhibition of Rho kinase with 100 µM Y27632 are summarised in violin box plots. Data result from four independent experiments, with total sample size of n = 42 for control group and n = 39 for ROCK inhibitor (ROCK-Inh.) treatment. (B) Summary of signalling pathways downstream of cyclic nucleotides. Opposing roles of cGMP/PKG and cAMP/PKA in locust embryo enteric neuron migration have been established in [11] (marked by blue pathway linker). Typical downstream targets of PKG are Rho GTPases. Rho GTPases regulate actin cytoskeleton dynamics via activation of Rho-associated protein kinase (ROCK) [50,51]. p < 0.05 = *.

Similar articles

References

    1. Sasselli V., Pachnis V., Burns A.J. The enteric nervous system. Dev. Biol. 2012;366:64–73. doi: 10.1016/j.ydbio.2012.01.012. - DOI - PubMed
    1. Nagy N., Goldstein A.M. Enteric nervous system development: A crest cell’s journey from neural tube to colon. Semin. Cell Dev. Biol. 2017;66:94–106. doi: 10.1016/j.semcdb.2017.01.006. - DOI - PMC - PubMed
    1. Hartenstein V. Development of the insect stomatogastric nervous system. Trends Neurosci. 1997;20:421–427. doi: 10.1016/S0166-2236(97)01066-7. - DOI - PubMed
    1. Copenhaver P.F. How to innervate a simple gut: Familiar themes and unique aspects in the formation of the insect enteric nervous system. Dev. Dyn. 2007;236:1841–1864. doi: 10.1002/dvdy.21138. - DOI - PMC - PubMed
    1. Copenhaver P.F., Ramaker J.M. Neuronal migration during development and the amyloid precursor protein. Curr. Opin. Insect Sci. 2016;18:1–10. doi: 10.1016/j.cois.2016.08.001. - DOI - PMC - PubMed

LinkOut - more resources