

Opportunistic Detection of Chronic Kidney Disease Using CT-Based Measurements of Kidney Volume and Perirenal Fat
- PMID: 40869714
- PMCID: PMC12387138
- DOI: 10.3390/jcm14165888
Opportunistic Detection of Chronic Kidney Disease Using CT-Based Measurements of Kidney Volume and Perirenal Fat
Abstract
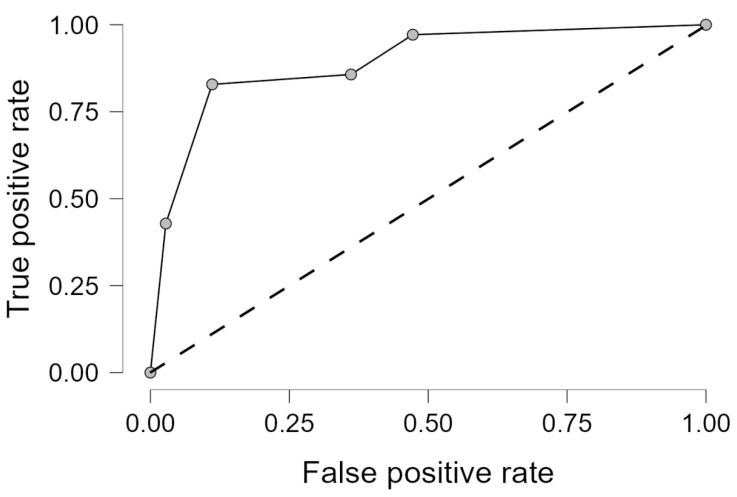
Background/Objectives: Chronic kidney disease (CKD) is a prevalent condition with many cases remaining undiagnosed, although early detection is essential. Adipose tissue distribution-particularly perirenal fat thickness (PrFT)-has recently been linked to renal pathophysiology. This study assessed the association between CT-derived parameters of fat distribution and kidney morphology with CKD. Materials and Methods: This retrospective study included 237 patients (117 subjects, 120 controls) who underwent abdominal CT and had serum creatinine data. The dataset was randomly split (70% training, 30% test) to develop and evaluate a logistic regression model. CKD was defined as estimated Glomerular Filtration Rate (eGFR) < 60 mL/min/1.73 m2. PrFT was measured as the distance from the posterior renal capsule to the posterior abdominal wall; renal hilum fat was segmented using a -195 to -45 HU range. Additional parameters (measured using automated segmentation tools) included kidney volume (KV), visceral/subcutaneous fat areas, skeletal muscle area and attenuation, and liver attenuation. Bilateral measurements were averaged. Results: KV (OR = 0.249, 95% CI: 0.146-0.422, p < 0.001) and PrFT (2nd tercile: OR = 7.720, 95% CI: 2.860-20.839; 3rd tercile: OR = 16.892, 95% CI: 5.727-49.822; both p < 0.001) were identified as independent predictors of CKD. These variables were used to construct a simplified model, which demonstrated moderate clinical applicability (AUC = 0.894) when evaluated on the test subset. Conclusions: KV and PrFT emerged as independent predictors of CKD, forming the basis of a simplified model with potential for opportunistic clinical application. This approach may facilitate earlier detection of CKD in patients undergoing CT imaging for unrelated clinical reasons. These imaging parameters are not intended to replace serum creatinine or eGFR but may serve as complementary predictors in specific clinical contexts.
Keywords: abdominal fat; chronic kidney disease; computed tomography; imaging biomarkers; kidney volume; opportunistic screening; perirenal fat; renal hilum attenuation; renal hilum fat; visceral fat.
Conflict of interest statement
The authors declare no conflicts of interest.
Figures


References
-
- Francis A., Harhay M.N., Ong A.C.M., Tummalapalli S.L., Ortiz A., Fogo A.B., Fliser D., Roy-Chaudhury P., Fontana M., Nangaku M., et al. Chronic kidney disease and the global public health agenda: An international consensus. Nat. Rev. Nephrol. 2024;20:473–485. doi: 10.1038/s41581-024-00820-6. - DOI - PubMed
Grants and funding
LinkOut - more resources
Full Text Sources
Research Materials
Miscellaneous
