. 2025 Jul 23;16(8):855.
doi: 10.3390/genes16080855.

Transcriptomic Identification of Key Genes Responding to High Heat Stress in Moso Bamboo (Phyllostachys edulis)

Affiliations

Transcriptomic Identification of Key Genes Responding to High Heat Stress in Moso Bamboo (Phyllostachys edulis)

Qinchao Fu et al. Genes (Basel). .

Abstract

Background/Objectives: Moso bamboo (Phyllostachys edulis), the most widely distributed bamboo species in China, is valued for both its shoots and timber. This species often faces challenges from high-temperature stress. To cope with this stress, Moso bamboo has evolved various adaptive mechanisms at the physiological and molecular levels. Although numerous studies have revealed that a large number of transcription factors (TFs) and genes play important roles in the regulatory network of plant heat stress responses, the regulatory network involved in heat responses remains incompletely understood. Methods: In this study, Moso bamboo was placed in a high-temperature environment of 42 °C for 1 h and 24 h, and transcriptome sequencing was carried out to accurately identify key molecules affected by high temperature and their related biological pathways. Results: Through a differential expression analysis, we successfully identified a series of key candidate genes and transcription factors involved in heat stress responses, including members of the ethylene response factor, HSF, WRKY, MYB, and bHLH families. Notably, in addition to traditional heat shock proteins/factors, multiple genes related to lipid metabolism, antioxidant enzymes, dehydration responses, and hormone signal transduction were found to play significant roles in heat stress responses. To further verify the changes in the expression of these genes, we used qRT-PCR technology for detection, and the results strongly supported their key roles in cellular physiological processes and heat stress responses. Conclusions: This study not only deepens our understanding of plant strategies for coping with and defending against extreme abiotic stresses but also provides valuable insights for future research on heat tolerance in Moso bamboo and other plants.

Keywords: Moso bamboo (Phyllostachys edulis); heat stress responses; key genes; regulatory network.


Conflict of interest statement

The authors declare no conflict of interest.

Figures

Figure 1
Figure 1
Detection of chlorophyll fluorescence indexes after high-temperature stress in Moso bamboo leaves. (A) Fv/Fm, maximum quantum yield of PSII photochemistry. (B) Y(II), effective quantum yield of PSII photochemistry. (C) qP, photochemical quenching coefficient. (D) NPQ, non-photochemical quenching. Error bars indicate averages of measurements from at least three biological replicates, and asterisks indicate significant differences. Significant differences were analyzed using the one-way ANOVA method, * p < 0.05, ** p < 0.01. CK, 25 °C; T1, 42 °C for 1 h; T2, 42 °C for 24 h, same for subsequent figures unless noted. Error bars indicate averages of measurements from at least three biological replicates, and asterisks indicate significant differences. Significant differences were analyzed using the one-way ANOVA method, * p < 0.05, ** p < 0.01.
Figure 2
Figure 2
Gene annotation and transcription factor identification statistics. (A) Gene annotation statistics for 6 major databases. (B) Statistics on the number of major transcription factor families.
Figure 3
Figure 3
Correlation analysis between transcriptome samples. (A) A heatmap of correlations between samples. The right and bottom sides of the figure show the names of the samples, the left and top sides show the clustering of the samples, and differently colored squares represent the high or low correlation between the two samples. (B) Principal component analysis (PCA) of the samples. The distance of each sample point represents the distance between samples, with closer distances indicating higher similarity between them. (C) Venn analysis of the samples. Venn analysis demonstrates the number of genes/transcripts in each group of samples and the overlap of genes/transcripts between groups of samples; the distribution of the number of genes/transcripts in each group of samples can be visualized using Venn analysis.
Figure 4
Figure 4
Analysis of differentially expressed genes among transcriptomes. (A) Differential expression statistics of samples from each transcriptome. The horizontal axis represents the different differential comparison groups, and the vertical axis represents the corresponding number of up- and downregulated genes/transcripts. Red represents upregulation and blue represents downregulation. (B) Venn analysis of differentially expressed genes among transcriptome samples. Differently colored circles represent different gene sets, and the values represent the number of genes/transcripts that are shared and unique between different gene sets.
Figure 5
Figure 5
GO enrichment analysis of differentially expressed genes among transcriptomes. (A) List of the top 20 functional entries after GO enrichment analysis of DEGs in the T1 vs. CK group. (B) List of the top 20 functional entries after GO enrichment analysis of DEGs in the T2 vs. CK group. (C) List of the top 20 functional entries after GO enrichment analysis of DEGs in the T2 vs. T1 group.
Figure 6
Figure 6
KEGG enrichment analysis of differentially expressed genes among transcriptomes. (A) List of the top 20 metabolic pathways after KEGG enrichment analysis of DEGs in the T1 vs. CK group. (B) List of the top 20 metabolic pathways after KEGG enrichment analysis of DEGs in the T2 vs. CK group. (C) List of the top 20 metabolic pathways after KEGG enrichment analysis of DEGs in the T2 vs. T1 group.
Figure 7
Figure 7
GO and KEGG gene set enrichment chordal maps with Venn analysis. (A) GO enrichment analysis and top genes screened in T1 vs. CK group. (B) GO enrichment analysis and top genes screened in T2 vs. CK group. (C) KEGG enrichment analysis and top genes screened in T1 vs. CK group. (D) KEGG enrichment analysis and top genes screened in T2 vs. CK group. (E) Venn analysis of gene sets after GO and KEGG enrichment analysis in T1 vs. CK and T2 vs. CK groups. Detailed information can be found in Tables S6 and S7.
Figure 8
Figure 8
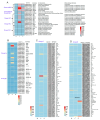
Heatmap analysis of the expression of key genes in key GO and KEGG metabolic pathways between comparative groups of transcriptome data. (A) Key differentially expressed genes common to both GO and KEGG enrichment analyses in multiple sample analysis groups. (B) Key genes in groups A and B. (C) Key differentially expressed genes in group C. (D) Key differentially expressed genes in group D. Groups A and B represent the top 100 differentially expressed genes in GO enrichment analysis in sample groups T1 vs. CK and T2 vs. CK, and groups C and D represent the top 100 differentially expressed genes in KEGG enrichment analysis in T1 vs. CK and T2 vs. CK, respectively.
Figure 9
Figure 9
qRT-PCR validation of 14 DEGs involved in the heat stress response in Moso bamboo. Error bars indicate averages of measurements from at least three biological replicates, and asterisks indicate significant differences. Significant differences were analyzed using the one-way ANOVA method, * p < 0.05, ** p < 0.01.

References

    1. Xiong Y., Liu X.-Q., Xiao P.-A., Tang G.-H., Liu S.-H., Lou B.-H., Wang J.-J., Jiang H.-B. Comparative transcriptome analysis reveals differentially expressed genes in the Asian citrus psyllid (Diaphorina citri) upon heat shock. Comp. Biochem. Physiol. D Genom. Proteom. 2019;30:256–261. doi: 10.1016/j.cbd.2019.03.009. - DOI - PubMed
    1. Wu H., Su X., Huang S., Singh V.P., Zhou S., Tan X., Hu X. Decreasing dynamic predictability of global agricultural drought with warming climate. Nat. Clim. Change. 2025;15:411–419. doi: 10.1038/s41558-025-02289-y. - DOI
    1. Ahmad L., Biswas A., Warland J., Anjum I. Climate Change and Agrometeorology. Springer Nature; Cham, Switzerland: 2023.
    1. Kompas T., Che T.N., Grafton R.Q. Global impacts of heat and water stress on food production and severe food insecurity. Sci. Rep. 2023;14:14398. doi: 10.1038/s41598-024-65274-z. - DOI - PMC - PubMed
    1. Balducci L., Deslauriers A., Giovannelli A., Beaulieu M., Delzon S., Rossi S., Rathgeber C.B. How do drought and warming influence survival and wood traits of Picea mariana saplings? J. Exp. Bot. 2015;66:377–389. doi: 10.1093/jxb/eru431. - DOI - PMC - PubMed

MeSH terms

LinkOut - more resources