Physiologically Based Pharmacokinetic Modeling to Assess Perpetrator and Victim Cytochrome P450 2C Induction Risk
- PMID: 40871104
- PMCID: PMC12389355
- DOI: 10.3390/pharmaceutics17081085
Physiologically Based Pharmacokinetic Modeling to Assess Perpetrator and Victim Cytochrome P450 2C Induction Risk
Abstract
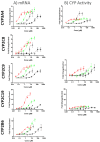
Background: Accurate assessment of CYP2C induction-mediated drug-drug interactions (DDIs) remains a challenge, despite the importance of CYP2C enzymes in drug metabolism. Limitations in available models and scarce clinical induction data have hampered quantitative preclinical DDI risk evaluation. Methods: In this study, the authors utilized an all-human hepatocyte triculture system to capture CYP2C induction using the perpetrators rifampicin, efavirenz, carbamazepine, and apalutamide. In vitro induction parameters were quantified by measuring changes in both mRNA and enzyme activities for CYP2C8, CYP2C9, and CYP2C19. These induction parameters, along with CYP-specific intrinsic clearance (CLint) for the victim compounds, were incorporated into a physiologically based pharmacokinetic (PBPK) model, and pharmacokinetics (PK) of known CYP2C substrates were predicted with and without co-administration of perpetrator compounds using clinical dosing regimens. The results were quantitatively compared with the currently utilized mechanistic static modeling (MSM) approach and the reported clinical DDI outcomes. Results: By incorporating the measured fm of CYP2C substrates into PBPK modeling, we observed a lower propensity to over- or underpredict the exposure of these substrates as victims of CYP2C induction-based DDIs when co-administered with known perpetrators, which resulted in an excellent correlation to observed clinical outcomes. The MSM approach predicted the CYP3A4 induction-based DDI risk accurately but could not capture CYP2C induction with similar precision. Conclusions: Overall, this is the first study that demonstrates the utility of PBPK modeling as a complementary approach to MSM for CYP2C induction-based DDI risk assessment.
Keywords: CYP2C induction; DDI; PBPK; hepatocytes; pharmacokinetics.
Conflict of interest statement
Marina Slavsky, Aniruddha Sunil Karve and Niresh Hariparsad are employees of AstraZeneca and receive stock or stock options. The remaining authors declare that the research was conducted in the absence of any commercial or financial relationships that could be construed as a potential conflict of interest.
Figures


Similar articles
-
Utilization of a human Liver Tissue Chip for drug-metabolizing enzyme induction studies of perpetrator and victim drugs.Drug Metab Dispos. 2025 Jan;53(1):100004. doi: 10.1124/dmd.124.001497. Epub 2024 Nov 22. Drug Metab Dispos. 2025. PMID: 39884808
-
Drug-Drug Interactions and Combination Therapy Strategies of Amiodarone With Digoxin, Rivaroxaban, and Phenytoin Assessed by Physiologically Based Pharmacokinetic Modeling.Pharmacotherapy. 2025 Aug 12. doi: 10.1002/phar.70050. Online ahead of print. Pharmacotherapy. 2025. PMID: 40798896
-
Physiologically based pharmacokinetic modeling of aldehyde oxidase drug-drug interactions mediated by erlotinib.Drug Metab Dispos. 2025 Aug;53(8):100113. doi: 10.1016/j.dmd.2025.100113. Epub 2025 Jun 23. Drug Metab Dispos. 2025. PMID: 40683226
-
Systemic pharmacological treatments for chronic plaque psoriasis: a network meta-analysis.Cochrane Database Syst Rev. 2020 Jan 9;1(1):CD011535. doi: 10.1002/14651858.CD011535.pub3. Cochrane Database Syst Rev. 2020. Update in: Cochrane Database Syst Rev. 2021 Apr 19;4:CD011535. doi: 10.1002/14651858.CD011535.pub4. PMID: 31917873 Free PMC article. Updated.
-
Systemic pharmacological treatments for chronic plaque psoriasis: a network meta-analysis.Cochrane Database Syst Rev. 2021 Apr 19;4(4):CD011535. doi: 10.1002/14651858.CD011535.pub4. Cochrane Database Syst Rev. 2021. Update in: Cochrane Database Syst Rev. 2022 May 23;5:CD011535. doi: 10.1002/14651858.CD011535.pub5. PMID: 33871055 Free PMC article. Updated.
References
-
- Einolf H.J., Chen L., Fahmi O.A., Gibson C.R., Obach R.S., Shebley M., Silva J., Sinz M.W., Unadkat J.D., Zhang L., et al. Evaluation of various static and dynamic modeling methods to predict clinical CYP3A induction using in vitro CYP3A4 mRNA induction data. Clin. Pharmacol. Ther. 2014;95:179–188. doi: 10.1038/clpt.2013.170. - DOI - PubMed
-
- Zhang J.G., Ho T., Callendrello A.L., Clark R.J., Santone E.A., Kinsman S., Xiao D., Fox L.G., Einolf H.J., Stresser D.M. Evaluation of calibration curve–based approaches to predict clinical inducers and noninducers of CYP3A4 with Plated human hepatocytes. Drug Metab. Dispos. 2014;42:1379–1391. doi: 10.1124/dmd.114.058602. - DOI - PubMed
-
- Kenny J.R., Ramsden D., Buckley D.B., Dallas S., Fung C., Mohutsky M., Einolf H.J., Chen L., Dekeyser J.G., Fitzgerald M., et al. Considerations from the Innovation and Quality Induction Working Group in Response to Drug-Drug Interaction Guidances from Regulatory Agencies: Focus on CYP3A4 mRNA In Vitro Response Thresholds, Variability, and Clinical Relevance. Drug Metab. Dispos. 2018;46:1285–1303. doi: 10.1124/dmd.118.081927. - DOI - PubMed
LinkOut - more resources
Full Text Sources

