Review
. 2025 Aug 12;17(16):2198.
doi: 10.3390/polym17162198.

Carbon Nanohorns and Their Nanohybrid/Nanocomposites as Sensing Layers for Humidity Sensors-A Review

Affiliations
Review

Carbon Nanohorns and Their Nanohybrid/Nanocomposites as Sensing Layers for Humidity Sensors-A Review

Bogdan-Catalin Serban et al. Polymers (Basel). .

Abstract

Carbon nanohorns (CNHs), along with their nanocomposites and nanohybrids, have shown significant potential for humidity (RH) monitoring at room temperature (RT) due to their exceptional physicochemical and electronic properties, such as high surface area, tunable porosity, and stability in nanocomposites. Resistive sensors incorporating CNHs have demonstrated superior sensitivity compared to traditional carbon nanomaterials, such as carbon nanotubes and graphene derivatives, particularly in specific RH ranges. This review highlights recent advancements in CNH-based resistive RH sensors, discussing effective synthesis methods (e.g., arc discharge and laser ablation) and functionalization strategies, such as the incorporation of hydrophilic polymers or inorganic fillers like graphene oxide (GO) and metal oxides, which enhance sensitivity and stability. The inclusion of fillers, guided by Pearson's Hard-Soft Acid-Base (HSAB) theory, enables tuning of CNH-based sensing layers for optimal interaction with water molecules. CNH-based nanocomposites exhibit competitive response and recovery times, making them strong candidates for commercial sensor applications. However, challenges remain, such as optimizing materials for operation across the full 0-100% RH range. This review concludes with proposed research directions to further enhance the adoption and utility of CNHs in sensing applications.

Keywords: carbon nanohorns; hydrophilic polymers; monohybrids; nanocomposites; resistive sensors.


Conflict of interest statement

The authors declare no conflicts of interest.

Figures

Figure 1
Figure 1
Several application areas for humidity sensors.
Figure 2
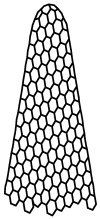
Figure 2
The structure of CNHs.
Figure 3
Figure 3
The synthesis of oxidized carbon nanohons (CNHox).
Figure 4
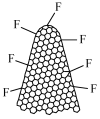
Figure 4
The structure of fluorinated carbon nanohorns (CNHs-F).
Figure 5
Figure 5
The structure of oxyfluorinated carbon nanohorns (CNHox-F).
Figure 6
Figure 6
(a) The metal stripes of IDT (interdigitated structure), and (b) the polyimide-based sensing structure used for resistive RH monitoring. Alternatively, a flexible substrate made from polyimide (3.95 × 3.95 mm2), with gold interdigitated electrodes (Au IDTs), as depicted in (b), can also be used for a CNH-based resistive RH sensor [82].
Figure 7
Figure 7
The RH response of the CNHox-based sensor in: (a) humid nitrogen (red curve) vs. the RH response of the Sensirion RH sensor (blue curve); and (b) humid air (red curve) vs. the RH response of the Sensirion RH sensor (blue curve) [87].
Figure 8
Figure 8
The transfer function of the CNHox-based sensor in: (a) humid air (RH = 10–90%); and (b) humid nitrogen (RH = 10–90%) [87].
Figure 9
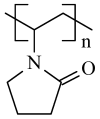
Figure 9
The structure of PVP.
Figure 10
Figure 10
Comparison between the response of the Sensirion commercially available RH sensor (blue line) and the manufactured CNHox-PVP-based (1/2 w/w ratio) RH sensor (red line).
Figure 11
Figure 11
The structure of PEG–PPG–PEG.
Figure 12
Figure 12
The output signal (voltage) measured when a constant current (0.1 A) is applied to the IDT RH-sensing structure, employing the PEG–PPG–PEG nanocomposite as the sensing layer, for variations in RH from 0% to 98%.
Figure 13
Figure 13
The structure of GO.
Figure 14
Figure 14
SEM of the GO–CNHox–PVP–based sensing layer at 1:1:1 w/w/w ratio: (a) 50,000× magnification; (b) 200,000× magnification.
Figure 15
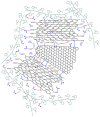
Figure 15
Mutual interactions for the supermolecule generated from CNHox, GO, and PVP [90].
Figure 16
Figure 16
The transfer function of the GO–CNHox–PVP-based (at 1/1/1, 1/2/1, and 1/3/1 w/w/w mass ratios) RH sensors in humid nitrogen (RH = 0–100%) [90].
Figure 17
Figure 17
(a) The procedure of calculating the response time as the difference between t90% and t10%; and (b) the ratio of response times of RH sensors 111, 121, and 131 humidity sensors at RT relative to the response time of the reference sensor.
Figure 18
Figure 18
Resistance versus RH variation for the manufactured CNH–PVP–based sensor (red curve) and the reference commercial sensor (blue curve) [93].
Figure 19
Figure 19
Resistance versus RH for the: (a) K1 sensor (CNHox/KCl/PVP, 7/1/2, w/w/w) and for the reference sensor; (b) K2 sensor (CNHox/KCl/PVP, 6.5/1.5/2, w/w/w) and for the reference sensor; and (c) K1 sensor (CNHox/KCl/PVP, 6/2/2, w/w/w) and for the reference sensor in several operating sequences [99].
Figure 20
Figure 20
Graphical representations of the ratios between the response time of the manufactured CNHox/KCl/PVP-based sensors (a) K1 sensor; (b) K2 sensor; and (c) K3 sensor and the response time of the commercial sensor, measured in humid nitrogen, when varying RH from 0% to 100% [99].
Figure 21
Figure 21
Raman spectra of the CNHox/TiO2/PVP nanocomposite solid-state film, with a 3:1:1 w/w/w mass ratio, deposited on glass, were recorded at four different points of the nanohybrid [100,101].
Figure 22
Figure 22
The response of the manufactured sensor: (a) T1; (b) T2; and (c) T3, as a function of time for three complete measurement cycles, when varying RH between 0% and 100%; “RH curve-red” shows the variation of the RH in the testing chamber, as indicated by the reference sensor [101,102].
Figure 23
Figure 23
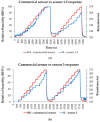
The response of: (a) “Sensor 1.5”, and (b) “Sensor “3” (“R curve”-blue) as a function of time for two measurement cycles, while increasing RH in 10 steps from 0% to 100% RH; “RH curve-red” shows the similar characteristic measured for a commercial, capacitive sensor [107].
Figure 24
Figure 24
(a) Response times for “Sensor 1.5” and “Sensor 3” with RH increasing from 0% to 100%, with a 10% step, in the second measurement cycle recovery times for (b) “Sensor 1.5” and (c) “Sensor 3” after the second measurement cycle; the recovery time was measured by varying RH from 100% to 0% (clean, dry nitrogen) [107].
Figure 25
Figure 25
The response of (a) “Sensor 0.75” and (b) “Sensor 1.0” (“R curve-blue” curves) presented as a function of time for three measurement cycles while varying RH, in 10 steps, from 0% to 100%; “RH curve-red” shows the similar characteristic measured for a commercial, capacitive sensor [108].
Figure 25
Figure 25
The response of (a) “Sensor 0.75” and (b) “Sensor 1.0” (“R curve-blue” curves) presented as a function of time for three measurement cycles while varying RH, in 10 steps, from 0% to 100%; “RH curve-red” shows the similar characteristic measured for a commercial, capacitive sensor [108].
Figure 26
Figure 26
The transfer function of the quaternary CNHox/GO/SnO2/PVP nanohybrid-based resistive sensors in humid nitrogen (RH = 0–100%) [108].
Figure 27
Figure 27
The swelling of the hydrophilic polymer included in CNH-based nanocomposites upon interaction with water.

Similar articles

References

    1. Kuzubasoglu B.A. Recent studies on the humidity sensor: A mini review. ACS Appl. Electron. Mater. 2022;4:4797–4807. doi: 10.1021/acsaelm.2c00721. - DOI
    1. Arundel A.V., Sterling E.M., Biggin J.H., Sterling T.D. Indirect health effects of relative humidity in indoor environments. Environ. Health Perspect. 1986;65:351–361. - PMC - PubMed
    1. Davis R.E., McGregor G.R., Enfield K.B. Humidity: A review and primer on atmospheric moisture and human health. Environ. Res. 2016;144:106–116. doi: 10.1016/j.envres.2015.10.014. - DOI - PubMed
    1. Wolkoff P. Indoor air humidity, air quality, and health—An overview. Int. J. Hyg. Environ. Health. 2018;221:376–390. doi: 10.1016/j.ijheh.2018.01.015. - DOI - PubMed
    1. Barmpakos D., Kaltsas G. A review on humidity, temperature, and strain printed sensors—Current trends and future perspectives. Sensors. 2021;21:739. doi: 10.3390/s21030739. - DOI - PMC - PubMed

LinkOut - more resources