. 2025 Jul 26;13(8):1752.
doi: 10.3390/microorganisms13081752.

Local Fungi Promote Plant Growth by Positively Affecting Rhizosphere Metabolites to Drive Beneficial Microbial Assembly

Affiliations

Local Fungi Promote Plant Growth by Positively Affecting Rhizosphere Metabolites to Drive Beneficial Microbial Assembly

Deyu Dong et al. Microorganisms. .

Abstract

Ecological restoration in the cold and high-altitude mining areas of the Qinghai-Tibet Plateau is faced with dual challenges of extreme environments and insufficient microbial adaptability. This study aimed to screen local microbial resources with both extreme environmental adaptability and plant-growth-promoting functions. Local fungi (DK; F18-3) and commercially available bacteria (B0) were used as materials to explore their regulatory mechanisms for plant growth, soil physicochemical factors, microbial communities, and metabolic profiles in the field. Compared to bacterial treatments, local fungi treatments exhibited stronger ecological restoration efficacy. In addition, the DK and F18-3 strains, respectively, increased shoot and root biomass by 23.43% and 195.58% and significantly enhanced soil nutrient content and enzyme activity. Microbiome analysis further implied that, compared with the CK, DK treatment could significantly improve the α-diversity of fungi in the rhizosphere soil (the Shannon index increased by 14.27%) and increased the amount of unique bacterial genera in the rhizosphere soil of plants, totaling fourteen genera. Meanwhile, this aggregated the most biomarkers and beneficial microorganisms and strengthened the interactions among beneficial microorganisms. After DK treatment, twenty of the positively accumulated differential metabolites (DMs) in the plant rhizosphere were highly positively associated with six plant traits such as shoot length and root length, as well as beneficial microorganisms (e.g., Apodus and Pseudogymnoascus), but two DMs were highly negatively related to plant pathogenic fungi (including Cistella and Alternaria). Specifically, DK mainly inhibited the growth of pathogenic fungi through regulating the accumulation of D-(+)-Malic acid and Gamma-Aminobutyric acid (Cistella and Alternaria decreased by 84.20% and 58.53%, respectively). In contrast, the F18-3 strain mainly exerted its antibacterial effect by enriching Acidovorax genus microorganisms. This study verified the core role of local fungi in the restoration of mining areas in the Qinghai-Tibet Plateau and provided a new direction for the development of microbial agents for ecological restoration in the Qinghai-Tibet Plateau.

Keywords: beneficial microorganisms; ecological restoration; local fungi; promoting plant growth; rhizosphere metabolites.


Conflict of interest statement

The authors declare no conflicts of interest.

Figures

Figure 1
Figure 1
Effects of strain treatment on plant growth and leaf biochemical contents. (A) Plant growth, including shoot length, root length, stem diameter, tiller number, shoot biomass, and root biomass. (B) Leaf biochemical contents, including total protein, PRO, MDA, SSu. and chlorophyll content. Different lowercase letters above column represent significant differences (p < 0.05), n = 3.
Figure 2
Figure 2
Strain treatment drives assembly changes in endophytic and rhizosphere microbial community structures of plants. Composition of fungi (A) and bacteria (B) at phylum level and composition of fungi (C) and bacteria (D) at order level. Top 10 relative abundances of fungal and bacterial compositions.
Figure 3
Figure 3
Response analysis of the composition and abundance of microbial communities at the genus level in plant niches to strain treatments. The number of fungal genera (A) and bacterial genera (C) in plant niches under different strain treatments. The histogram in the lower left corner indicates the number of microbial genera in each plant niche, and the bar chart on the right shows the number of various microbial sets intersecting in plant niches. The single points below represent specific genera in the microbial sets, and the connections between some points indicate the number of shared genera. Stacked bar charts of the relative abundance of shared fungal genera (B) and bacterial genera (D). Relative abundances > 1%.
Figure 4
Figure 4
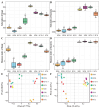
The effects of different strain treatments on the alpha and beta diversity of microorganisms in plant niches. The box plots of alpha diversity show the Sobs index (A) and Shannon index (C) of the fungal community and the Sobs index (B) and Shannon index (D) of the bacterial community at the OTU level. The boxes represent the average values of three biological replicates for each treatment, and the significance was tested using a t-test. Different lowercase letters indicate significant differences at the p < 0.05 level. The principal coordinate analysis plots show the changes in the composition of fungal (E) and bacterial (F) communities in two plant niches (roots and rhizosphere soil) under four treatments. The two-dimensional principal coordinates based on the Bray–Curtis distance were analyzed by the Adonis method for multivariate permutation to test the microbial differences. Each point represents a single composition sample, and different colors in the figure represent different strain treatments and different niches. RDK and SDK represent plant roots and rhizosphere soil after treatment with the DK strain; RF18-3 and SF18-3 represent plant roots and rhizosphere soil after treatment with the F18-3 strain; RB0 and SB0 represent plant roots and rhizosphere soil after treatment with the B0 strain; and RCK and SCK represent the plant roots and rhizosphere soil of the control group.
Figure 5
Figure 5
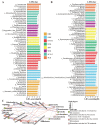
Biomarker identification and interaction analysis. The LEfSe (LDA effect size) discrimination result graph is used to display the endophytic and rhizosphere fungal (A) and bacterial (B) community biomarkers with significant differences among the four treatments. The length of the LEfSe bar represents the influence size of the biomarker. The LDA score threshold is log10 (LDA score) > 4, with p < 0.05. The higher the LDA score, the greater the influence of species abundance on the difference effect. The interaction network of plant root and rhizosphere biomarkers after DK, F18-3; (C) B0 and CK treatments is shown (|r| > 0.7, and p < 0.05). The color of each node represents the biomarkers of different ecological niches of fungi and bacteria, and the size of the node represents the number of biomarkers significantly related to it. The larger the node, the more biomarkers it is related to. The red lines represent positive correlations, and the blue lines represent negative correlations.
Figure 6
Figure 6
The effects of strain treatments on the accumulation of metabolites in the rhizosphere soil of plants. (A) A cluster heatmap of metabolites in the rhizosphere soil of plants after four treatments. Different colors in the row annotation column represent different supercategories, and different colors in the column annotation column represent different strain treatments. (B) The number of differential metabolites (DMs) identified in different comparison groups based on VIP of OPLS-DA and univariate statistical analysis (VIP > 1, and p < 0.05). (C) K-means clustering analysis of 464 DMs. The x-axis represents four different treatments, and the y-axis depicts the relative changes in the metabolite content. (D) KEGG enrichment analysis of DMs in five clusters. The depth of color is determined by −log10 (Qvalue), with darker colors indicating smaller Qvalues and more significant metabolic and biosynthetic pathways. The annotation column shows the treatment group corresponding to each cluster.
Figure 7
Figure 7
Correlation analysis between biomarkers and differential metabolites. Procrustes analysis between the metabolome and fungal (A) or bacterial (B) communities. The microbial communities consist of plant roots and rhizosphere fungi or bacteria. PCoA was used to reduce the dimensionality of the microbiome and metabolome data, followed by Procrustes analysis. M2 represents the sum of squared distances between matching sample pairs, and a smaller value indicates a stronger correlation between the two datasets. p < 0.01 indicates a highly consistent change between the two datasets; p < 0.05 indicates a consistent change; p > 0.05 indicates an insignificant association trend. The lines represent the Procrustes residuals of the two ordered configurations, and shorter lines indicate higher consistency between the two datasets. (C) The Mantel test was used to analyze the relationship between plant variables and fungal biomarkers (determined by the Bray–Curtis distance) and DMs (determined by the Euclidean distance). The Mantel’s r value is represented by the edge width, while the statistical significance is indicated by the edge color. The pairwise correlations between DMs are represented by a color gradient reflecting Spearman’s correlation coefficient. Plant growth (shoot length, root length, and stem diameter), plant biomass (shoot biomass and root biomass), soil enzyme activities (S-AL, S-GC, S-PPO, and S-CL), plant physiology (total protein, PRO, SSu, and chlorophyll content), endophyte fungi (26 biomarkers in plant roots) and rhizosphere fungi (24 biomarkers in plant rhizosphere). (D) A heatmap based on the Pearson correlation indicates the association between core metabolites and fungi (biomarker genera). Metabolites are at the bottom, and fungi are on the right. The stars indicate Pearson correlation coefficients (** p < 0.01; * 0.01 < p < 0.05), and the “blue to red” color gradient represents the Pearson correlation coefficient values, with deeper red indicating a larger positive Pearson correlation coefficient and deeper blue indicating a larger negative Pearson correlation coefficient. The column annotation bars in different colors represent DMs from different comparison groups, while the row annotation bars in different colors represent fungi from different treatment groups.

Similar articles

References

    1. Feng Y., Wang J., Bai Z., Reading L. Effects of surface coal mining and land reclamation on soil properties: A review. Earth-Sci. Rev. 2019;191:12–25. doi: 10.1016/j.earscirev.2019.02.015. - DOI
    1. Hu Y., Yu Z., Fang X., Zhang W., Liu J., Zhao F. Influence of mining and vegetation restoration on soil properties in the eastern margin of the Qinghai-Tibet Plateau. Int. J. Environ. Res. Public Health. 2020;17:4288. doi: 10.3390/ijerph17124288. - DOI - PMC - PubMed
    1. Worlanyo A.S., Li J. Evaluating the environmental and economic impact of mining for post-mined land restoration and land-use: A review. J. Environ. Manag. 2021;279:111623. doi: 10.1016/j.jenvman.2020.111623. - DOI - PubMed
    1. Ge H., Feng Y., Li Y., Yang W.L., Gong N. Heavy metal pollution diagnosis and ecological risk assessment of the surrounding soils of coal waste pile at Naluo Coal Mine, Liupanshui, Guizhou. Int. J. Min. Reclam. Environ. 2016;30:312–318. doi: 10.1080/17480930.2015.1050840. - DOI
    1. Li F., Li X., Hou L., Shao A. Impact of the coal mining on the spatial distribution of potentially toxic metals in farmland tillage soil. Sci. Rep. 2018;8:14925. doi: 10.1038/s41598-018-33132-4. - DOI - PMC - PubMed

LinkOut - more resources